Technical and digital analysisWe notice that we are in the process of a complex and large correction for the rise, and there is an increase in the selling momentum, and we wait for the selling momentum to weaken in the correction, and we buy and there is divergence
BA trade ideas

Only This Stock Can Boost Up 🚀Hi there its Lubosi Stocks Here
--
Am so tired
from working outside on yard work
--
Good news is you get to benefit from
this trading journal
right here on trading view platform
--
This stock is a good buy for 3 reasons:
--
#1 The price is above the 50 EMA
#2 The price is above the 200 EMA
#3 The price has a catalyst such as the earnings report or the Gap up
-
I would love to thank my mentors
Mathew Kratter, Timothy Sykes, and Robert Kiyosaki
-
for inspiring to keep learning on trading
--
Please do your own research before you trade
--
make sure to reread this article to learn more
rocket boost this
--
Thanks,
Lubosi Stocks


BA LongOver 225 can start $40 leg up to 267 - has been consolidating here for several months. Can have large upsized move into 267 then 294.
I am long BA since 204 to target 294. Raised stops to 210.

Boeing: Potencial 16.5%There is a bullish pennant on the chart. We are going to conquer the highs of 2021.
Good luck to all! If you liked it - subscribe.

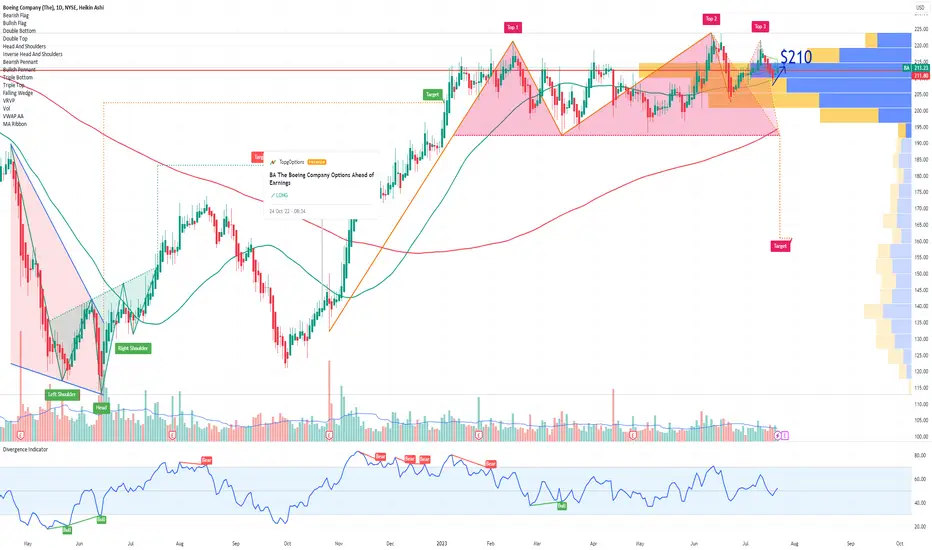
BA The Boeing Company Options Ahead of EarningsIf you haven`t bought BA here:
Then analyzing the options chain and the chart patterns of BA The Boeing Company prior to the earnings report this week,
I would consider purchasing the 210usd strike price in the money Calls with
an expiration date of 2023-8-18,
for a premium of approximately $8.45.
If these options prove to be profitable prior to the earnings release, I would sell at least half of them.
Looking forward to read your opinion about it.
FTEKThis technical analysis of FuturaTech Inc. (FTEK) aims to equip traders with valuable insights into the stock's potential future price movements. By combining various indicators and chart patterns, traders can develop a comprehensive trading strategy to capitalize on profit opportunities while managing risk effectively. Remember to perform your due diligence and consider other fundamental factors before making any trading decisions. Happy trading!

Boeing BA multi months BreakoutBA is breaking out after consolidation for 6 months and with lot of volume. Can be put on watchlist for swing trade. I am looking for a little pullback before entering this trade. However I made good by Day Trading this stock yesterday.
Will post more updates about this trade.

BA after earnings pop. Will it drop?Boeing had a big pop from very favorable earnings today. So far there has
not been a fade or retracement. The relative strength lines however topped
out and then retreated a bit signaling bearish divergence with the lower TF
below the higher black TF line. Likewise,
the MACD indicator is showing a line cross above the histogram whose
amplitude has dropped to zero then changed to red / negative.
Lastly, the mass index indicator shows a rise above the reversal zone
then with a trigger signal in dropping below the zone.
I conclude that BA over-extended and is now setup for a short trade which
could be either stocks or a put option. For the stock the stop loss is 232
the swing high and the target is 223.25 at the mean VWAP line. If price can
cross under that line, the target for the remaining runners will be 217 just
above a lower VWAP line. I will buy the strike $225 expiring 8/4 to potentially
exploit this expected quick retracement.

Boeing trading above channel resistanceBoeing Company (BA) presently trading above channel resistance, able to absorb weekly selling pressures.
If a weekly settlement above this resistance occurs, (BA) will be placed into a buy signal where gains of 20-25% would be anticipated over the following 2 - 3 months.
Inversely, if (BA) fails to close above the channel top at the end of this week, this will allow (BA) to fall back to channel support, eliciting losses of a similar magnitude over the next 1 - 2 months.

Boeing (BA): In Distribution CycleBA has tried to evade successive negative divergence, appears to be in a distribution hold. Price has also fallen out of the Pitchfork that guided the uptrend. We can expect price to begin to trend downwards, expectation would be a swift move to the downside.

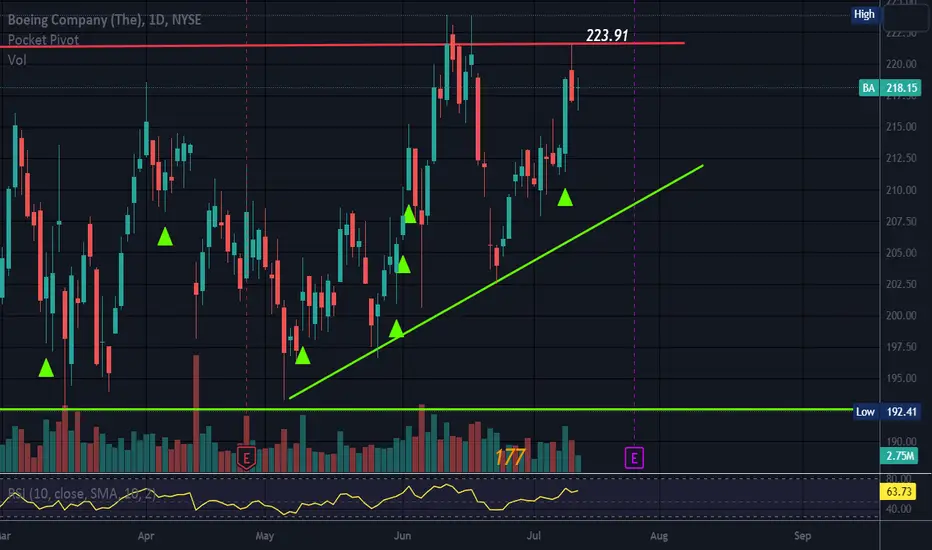
Honestly $BA is this week as well ?Since January this thing has been accumulating around 192-218. the next leg will be huge, but will i be a part of it idk hopefully i don't miss it.

BABoeing might just be giving head fakes for now although this one is has been forming a bullish flag for quite some time now and I believe that it could seriously breakout as long as 212 keeps holding on the stock.

BA Bull pennant or fake outRight now looking at a daily bull pennant on BA top of 219 or bottom below 196. If we zoom out to to larger time frame we are still in a slightly bearish flow. A third retest of the high (original and one already) will confirm direction.
Worse case senario we stay within this range for a while depending on future sales of BA airplanes.

RectangleAscending triangle noted inside the rectangle.
Both are neutral patterns until broken.
No recommendation
BA - Bullish PatternWaiting for inital breakout to confirm bullish, Bought 220C for Friday expiry, starting small.

$BA - July 12, Gameplan! NYSE:BA - July 12, Gameplan!
Looking for any pull /backs to hold , above 215 Area!
for a move up to 223-225
Buying Break above 219!
On Tuesday, July 11, 2023, Boeing experienced a positive day as its stock price rose by 2.55%, increasing from $213.31 to $218.76. Throughout the trading day, the stock fluctuated between a low of $211.35 and a high of $218.98, representing a 3.61% range. Over the past two weeks, the stock has shown a positive trend, rising by 6.41%, with gains in 6 out of the last 10 days. The trading volume on this day was higher than the previous day, indicating a positive technical sign, with a total of 7 million shares being bought and sold, amounting to approximately $1.62 billion.

$BA - Looking for a move above 213.65! NYSE:BA - Boeing insiders have displayed a strong positive sentiment by purchasing more shares than they have sold. Over the last 100 trades, there were 271.29 thousand shares bought and 19.17 thousand shares sold. The most recent trade, conducted 8 days ago by Bradway Robert A, involved the purchase of 420.21 shares. This significant difference between the amount of stocks bought and sold suggests that insiders have a favorable outlook on the potential upside. It's worth noting that in certain instances, larger purchases may be attributed to upcoming stock option deadlines.
NYSE:BA - Airbus books record India orders, confirms higher deliveries

Ready to fly?After all this crazy volatility last week, on thing is clear, the DOW wants to break up. I chose this DOW stock, look at the consolidation. I thinks is going to pop soon.

Aviation Vs. The Market: Lessons to be learnedHey everyone, still on a bit of a hiatus.
I am actually on vacation in a cabin, but I have been working on this posting from research to writing for about 2 weeks now and really want to just be done with it, else I find myself driven to keep modifying and reviewing and editing. Among the things I always really do well with, at least in grad school, are my philosophy courses. This post is very grounded in philosophy. Hopefully you enjoy it!
As this relates to aviation, I thought it best to post on Boeing.
And for the post:
One of the greatest, philosophical questions and misconceptions I had when I started trading is that markets could be predicted reliably. I figured that it was all a sham that they were this elusive beast out to make a mockery of the unfortunate souls who attempted to master its supreme logic. After all, markets are a creation of people right? They are not some naturally occurring phenomenon that we cannot tangibly observe, they are the function of rules, operations and processes that we ourselves designed.
In fact, most things about markets are artificial and human made. From the companies that are listed on them, to the money that is secured against them, for the most part, they are all based on our own prices and processes. We, humankind, created the markets. We set the rules, parameters, platforms and laws and regulations on the markets ourselves. We inject money, time, resources and people into it. We created this as a vehicle of wealth transfer, storage and growth. For us to claim that we can’t predict or can’t know the market is like saying “We don’t understand how planes fly”. We build the components of the plane, the materials for the plane and we understand the mechanisms and physics involved in the success of an aircraft, otherwise, planes wouldn’t exist. Very much like the market.
And over the years and time I realized this proved somewhat true. Markets, for the most part, are predictable in a sense. They operate on a predominate bull bias, as they were designed to. The answer almost always is up. If you know nothing about finance and markets and stocks and simply invest your money every day, week or month in some ETFs, you will be in a way better position than most people come retirement. This is by design. Even if you bought at the top in 2021, provided you continued your contributions throughout 2022 and forward, you would likely be fine even by now, benefiting from the basic principles of dollar cost averaging (DCA), another clever market design (refer to footnote A if you want to read the results of me testing my hypothesis).
But, in terms of short-term price fluctuations, we can never be 100% sure about price direction and targets. As well, we can’t always be sure of major corrections or the onset of bear markets and recoveries. Why? Well, when I compared the market to planes, it turns out I was actually correct. However, it was my own naivety and lack of thought of how complex aviation, planes and piloting aircraft was that led me to oversimply things.
What do I mean by this? Well, let me explain.
I was correct to compare markets to aircrafts and planes. In fact they are very similar. They are man-made. The components of both the markets and aircrafts are all the product of manufacturing and human resources at the expense of money. They follow natural laws (for planes its physics, for markets is finance and math) and artificial laws (both markets and planes must comply with regulatory restrictions). However, I was incorrect in the simplicity and extent of my analogy and my lack of insight into the actual intricacies of planes and piloting. And that is, a plane is only understood for as long as it functions properly and the pilots behave rationally. However, at any time, at any place, any part of these complex, man-made machines can malfunction and cause chain reactions that leads into absolute chaos. And to that end, planes are only as good as their weakest link, whether that be the person piloting it or the machinery running it.
I want to draw attention to three separate and well-known aviation disasters. At first, you may wonder what it has to do with trading, but just bear with me for a second.
In 1972, Eastern Air Lines Flight 401 crashed shortly before landing into the Florida Everglades. The cause? A burnt out lightbulb which lead to preoccupied pilots. The pilots became so fixated on this burnt out light that they made several fatal errors. Forgetting to notice that their autopilot was disconnected and not paying attention to their altimeter. Refer to footnote B if you are interested in some psychology behind this.
In 1994, Aeroflot Flight 593 was en route to Kai Tak Airport in Hong Kong. At one point in the trip, the relief pilot took his two children, a son and daughter, to the cockpit to sit at the controls. It was standard practice at the time to permit children in the cockpit and at the controls believe it or not (as a child of the 90s, I got to “pilot” a 747 for a couple of minutes on route from Toronto to South America, (I believe it was Venezuela but so long ago), so I can attest to this practice first hand). Unfortunately, while his son was at the controls, he inadvertently disconnected the autopilot. This lead to a chain reaction of the plane losing altitude, nose diving, only to be momentarily recovered before crashing into a mountain due to the sustained loss of altitude. The worst part is, there was nothing mechanically wrong wit the plane. When the pilots noticed the issue at first, they were confused and over-reacted. This caused the plane to spiral, to which they over-reacted again. The tragedy is augmented by the fact that, had the pilots just removed themselves from the controls, the natural laws of physics and aerodynamics which are foundational to flying would have naturally corrected the planes loss of control, that was caused by the pilots themselves. Yes, simply letting the almighty physics take the wheel quite literally would have saved the entire flight.
In 1983, Air Canada Flight 143, a Boeing 767, ran out of fuel due to a miscalculation and a system error that wasn’t fully understood by the pilots. However, the pilots were able to break records and glide its way to an emergency landing at a nearby airport with no fatalities.
So what do these 3 things have anything to do with the market and trading? Well, everything. In these 3 situations we had 3 unique situations that all had various fundamental precursors that led to chain events with varying outcomes.
In each of these cases, all of these disasters could have, theoretically, been contemplated but the timing and exact circumstances of these disasters couldn’t have been predicted. They were a black swan event, so to speak. With hindsight, we can plan, fix, make changes and move forward. However, during the time of the actual crises, hindsight had yet to be achieved and the trajectory of the outcome were contingent on the pilots’ knowledge of their aircraft systems and the principles of aviation physics.
On the bright side, after all these disasters, reforms and advancements were put in place and made to prevent further happenings. The Eastern Air Lines Flight 401 crash led to improved warnings systems, a focus on crash survivability, better safety protocols and new regulations, just to name a few. Flight 593 made me among the lucky elite children of the 90s to have experienced such a practice and Flight 143 overhauled a relatively mundane aviation practice (refueling).
This is much like “market accidents”. Let’s take the 2008 financial crises as an example. A chain of fundamental problems lead to a chain reaction that caused a complete and utter financial disaster, gravely impacting the market. As a result, the crisis was reviewed and changes to policies, regulations and practices were implemented.
Let us look at the sequence of events of the Flight 401 Disaster and the 2008 Financial Crises in a flow chart:
2008 Financial Crisis:
Flight 401:
You see the similarities? In almost all of these cases there is some type of fundamental catalyst that leads to bad decisions, poor judgement and a spiraling of events. From a simple blown lightbulb, like on Flight 401, to relatively negligent 90s practices (letting children at cockpit controls), to a housing bubble. Such seemingly minor things can spiral out of hand so quickly depending on how they are managed.
You may be asking how does this help us predict markets? Sure, it may offer some similarities into financial crises, but no value in predicting and forecasting. And my response is, this is not true.
Markets are a function of randomness with a substantial bull bias (as we discussed above). Market’s were created by humans as a means of wealth accumulation. Markets are, fundamentally, designed to go up, in the same way a plane is designed to go up and fly. We know, for the most part, that most things will eventually go up, provided they are fundamentally sound, again, in the same way a plane that is mechanically sound will fly. And when this happens, we can, to some degree, make general predictions about prices and direction.
That said, a great deal of the market is random, just like a great deal of the external forces on a plane are random. Wind direction and speed, weather conditions, these are all random and need to be faced by the aircraft and pilots. The same is true for markets. Short term price movement is generally random. The end result should, at some point, equal us arriving at our destination (an increased valuation). However, unlike a plane, we don’t always have an ETA of arrival.
And much like a plane whose mechanical parts can fail, so too can the parts of a market. From the bankruptcy of a company, to the busts of bubbles, as passengers on this market flight, we are faced with mechanical faults, system failures, negligence policies and bad piloting that we have to accept and move on from.
There is one fundamental difference though that I believe is critical to highlight. And that is, we, as market participants, are not merely passengers who have hopped on this flight for the ride. We are, in essence, pilots of someone else’s plane. Yes, this plane can be mechanically unsound at times. It can spiral into a nose dive down or, it can catch a nice breezy jet stream for a smooth ride to Hawaii. We do not have control over these random happenings.
But what we can choose and exercise discretion over is what kind of pilot we are. Are we the kind that gets so fixated on a single happening that we completely lose sight of the larger picture? Ignoring what is right in front of us in pursuit of something or some issue we hold so vehemently as the pinnacle of importance? Are we the kind that tries to over-compensate a situation that will eventually work itself out by sheer principles of market mechanics? Or are we the pilots that break world records and face the good times and the bad times and bring ourselves in for a soft landing, regardless of what hand our plane deals us?
The answer is for you, the reader, to decide and reflect on. Neither is right or wrong. And I really want to emphasize, we cannot really fault anyone in any of these situations, regardless of outcome (both the pilots in these examples and to those who adopt any one of these trading styles). Situations are unique and humans are complex, biased and emotional beings that are generally ill-adept at maintaining objectivity and logic in times of high stress. However, we can reflect and learn from the happenings of others and ourselves and try our best to glide our way to safety.
So I pose to you, the reader, this question... Which pilot are you?
Footnotes
Footnote A: Dollar Cost Averaging Experiment
Despite the concept of dollar cost averaging (DCA) and investing being a well established rule, I decided to do a mini experiment to verify these findings and my hypothesis (that is, had you invested at the top and continued to invest even during the bear market, you would still be ahead).
To do this, I created a simple algorithm using Excel. I had it buy 5 shares of SPY at a random price each month (more specifically, a random price provided it was no higher than the monthly high and no lower than the monthly low). I made the default setting a purchase of 5 shares each month. No months were skipped and each month 5 shares were being bought at a random price. It started in December 2021 and ended June 2023.
The result? By the end of this month (June 2023, also assuming you bought an additional 5 shares in June of 2023 at a random price), you would own a total of 95 shares of the SPY ETF. Your invested capital would be approximately $39,019. You’re P&L as of last month close would be approximately $3,092 or roughly an 8% increase in a 1.5 year period, in which a big portion of that 1.5 years was a bear market. Shocking huh?
Footnote B: Flight 401 Transcripts
As part of my research for this article, I reviewed the entire flight recorder transcripts for Flight 401. Why? Well, general curiosity, but as a practicing mental health clinician myself and someone who knows the “echo chamber” effect, I was pretty determined to take a look “into their minds”, so to speak.
And what I found was exactly what I suspected. Indeed, the crew fed each-other onto this narrative of the light being the most critical and pertinent thing. In fact, at one point I noticed a crew member stating “I am pretty sure its just a broken light”, to which the captain agreed and then continued, with futile attempts, to still get it repaired. After that point, the entire crew simply discussed the light error without discussing alternatives (for example, it is and was a practice at these times to do “Fly-bys” to have ground control check. Albeit, it was late at night and dark, this was still an option and a practice that was capable at the time, as the lighting technology required was there and present in 1972). Sadly, it wasn’t until seconds before impact that a crew member finally asked “Wait.. what is our altitude?”. Then you hear the crash. Its quite tragic.
While some could argue that the echo-chamber effect was in play here, based on my reading of the transcripts, it actually seems like a slightly mitigated version of “folie à plusieurs”. This is a psychiatric term that generally connotes a shared delusion or shared psychotic symptoms. But it is used, at least clinically, to also emphasized a sort of echo chamber effect, where one person’s preoccupation and irrational concern becomes the preoccupation and irrational concern of the group. The difference between this and an echo chamber is that, in echo chamber’s people chose to associate and follow individuals who suit their own narrative and thought process. In folie à plusieurs, there is usually a person in a position of power (in this case, the captain), whose irrationality and preoccupation ingrains itself on the crew. The crew were being quite logical, but the concern and worry of the captain had an impression on them and they likely felt obliged to follow through on his concerns, despite one even indicating this is not really an issue.
Folie à plusieurs can manifest anywhere. I have seen it in organizational management (especially in toxic work environments), I have read it documented in cults, I have seen it among family members in clinical practice and I have seen it even in online forms.
If you are interested in seeing these transcripts, you can search for the transcripts online, they are also on youtube.
Bullish Alert on $BAHourly Chart.
The most recent price action shows a bullish trend which started on May 03.
After the last (the third) confirmation, a new Bullish Alert popped out today.
Let's wait for the crossover to confirm it.

BA - Breaking out of flag
Chart doesn't need commentary, but bullflag breakout in progress.
long targets - 230, 260, Possibly 350
Buyers will scramble above 230

Boeing: Approach 🛬Boeing is approaching the low of wave (4) in magenta, but still has got room left to expand this movement further southward. As soon as it is finished, though, the share should turn upward to steer above the resistance at $228.16, heading for the dark green zone between $251.82 and $288.54. There, Boeing should complete wave 1 in dark green before maneuvering southward again. However, there is a 34% chance that the share could have concluded wave alt.1 in dark green by now. In that case, it would spin below the support at $173.85 and into the lower dark green zone between $168.58 and $141.08 to already develop wave alt.2 in dark green. This low would then initiate further upward movement.
