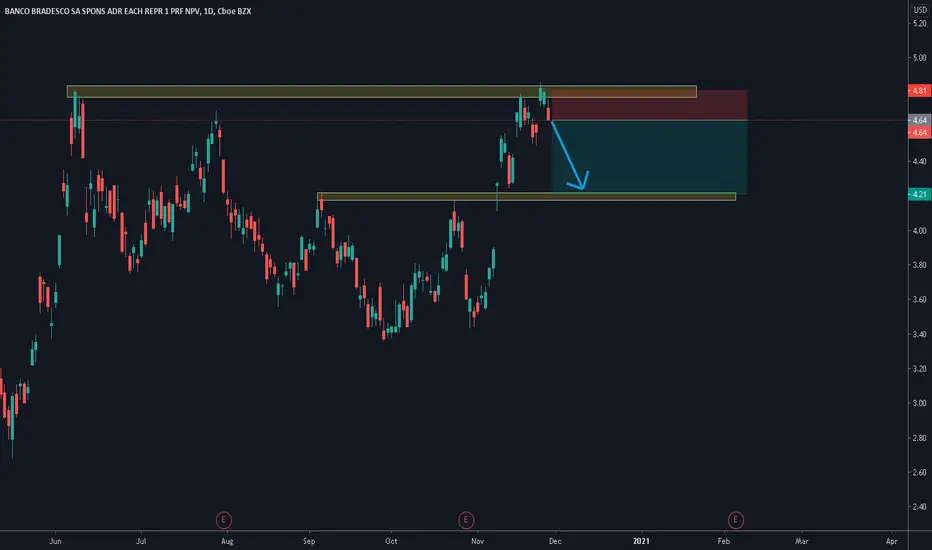
Bradesco - Breaking Trade 12/4/2024There was a great breakout trade opportunity on Bradesco's stock, enhanced by a refined entry strategy. The red zone highlights a key resistance level where the price struggled to break through. Eventually, a breakout occurred with a strong bullish candlestick, confirming buyers' strength. However, instead of entering immediately at the breakout, the ideal entry point would be on the pullback to the red zone.
After the breakout, the price retraced back to the resistance zone, which then acted as support. Notice how the price tested this zone but failed to close below it, indicating that buyers remained in control. The optimal entry would occur when the price breaks above the high of the retracement candle, confirming the continuation of the bullish move.
This approach allows for a more precise entry, reduces risk by setting a stop-loss below the support zone, and offers a better reward-to-risk ratio as the trend resumes upward. It’s a textbook example of a breakout-retest setup with confirmation.
Thank you for reading! If you found this content helpful, don’t forget to like, comment, and share the idea. Follow me on TradingView!
BBD trade ideas

BBDC4 BradescoPrice reached the support zone ( R$ 13.32 ).
Possible lateralization and then look for the target (resistance zone) at R$14.80 in the long term.

BBD UndervaluedLooks like it's broken out of that channel, however I think it
goes back down prior to earnings in November. Seriosuly considering
long term LEAPS on this. The Jan 2025 $3 calls are super cheap.
Book value is $15. Let me know what you think?
Pros
1. Rising trade
2. Receding inflation/lower rates
3. Better political environment
4. Revisions up for GDP 2023/2024
Cons
1. It's Brazil
2. Big trade partner is China

$BBD with a Bullish outlook following its earnings #Stocks The PEAD projected a Bullish outlook for $BBD after a Positive over reaction following its earnings release placing the stock in drift B with an expected accuracy of 25%.

$BBD with a Bullish outlook following its earnings #Stocks The PEAD projected a Bullish outlook for $BBD after a Negative over reaction following its earnings release placing the stock in drift C with an expected accuracy of 100%.

$BBDO with a Bullish outlook following its earnings #Stocks The PEAD projected a Bullish outlook for $BBDO after a Negative over reaction following its earnings release placing the stock in drift C with an expected accuracy of 100%.

Floor Broke Under Banco Bradesco. BBDIt's another zigzag in formation. Wave C confirmed and We are looking to further drops on this one. Not a reall shallow B Wave of one zigzag only. In our experience, it is more common to see a WXY in a B wave formation. The markets then show us once again that it has a plan of its own.
We are not in the business of getting every prediction right, no one ever does and that is not the aim of the game. The Fibonacci targets are highlighted in purple with invalidation in red. Fibonacci goals, it is prudent to suggest, are nothing more than mere fractally evident and therefore statistically likely levels that the market will go to. Having said that, the market will always do what it wants and always has a mind of its own. Therefore, none of this is financial advice, so do your own research and rely only on your own analysis. Trading is a true one man sport. Good luck out there and stay safe!


Long BBDIt looks like the MACD indicators are showing a strong long for this stock. I plan to enter at $3.98 with a stop at $3.88 and exit at $4.48 per share. That's a 10 cent loss or and 50 cent gain per share.

Bullish on Banco Bradesco. BBDA temporary respite, believing to be a Wave B of zig zag.
We are not in the business of getting every prediction right, no one ever does and that is not the aim of the game. The Fibonacci targets are highlighted in green with invalidation in red. Fibonacci goals, it is prudent to suggest, are nothing more than mere fractally evident and therefore statistically likely levels that the market will go to. Having said that, the market will always do what it wants and always has a mind of its own. Therefore, none of this is financial advice, so do your own research and rely only on your own analysis. Trading is a true one man sport. Good luck out there and stay safe!

Buy $BBD - NRPicks 03 SepBanco Bradesco S.A., together with its subsidiaries, offers various banking products and services to individuals, corporations and businesses in Brazil and internationally. The company operates through the Banking and Insurance segments. It offers leasing and brokerage services, among others.
Revenue TTM 18.3B
Net Income TTM 4.3B
Net Margin TTM 23.1%
P/E 11.19
P/S 0.51
P/B 0.29
Dividend yield 0.93%

BBD Great long ideaBBD has formed a new ascending channel
Great R.R
Using $4.12 as SL and $6.30 as target


BBD could suffer a devaluation of its shares.The whole explanation is based on this idea, keep in mind to always manage your risk in any operation.
Several banks could suffer another devaluation of their shares.
BBD could suffer a devaluation of its shares.
There you have it explained, a total of 22 pages of fundamental analysis, the technician could also give you the same idea, use monthly graphs and any tool to your personal taste.
Use any technical analysis, it will also validate the short. I don't need to explain any more reasons. The possibility of making an operation in CALL and selling its devalued shares in the hypothetical case that the economic crisis that several stock investors bet happens. Also, that the risk of loss would be small. Indicate the prices to take into account in a short operation. All the best :).

Upside potential hereLooks good for lots of upside potential here. Nice risk reward potential.
May still have a few days of chop though.


Test Before Going UPWe have previous rejection of this Resistance, short now before a long position?!
BBDC4, Formação de Pivo de Baixa no Gráfico DiárioBMFBOVESPA:BBDC4
Deixando de lado essa história de estrela cadente vamos ao gráfico, que vem demonstrado força compradora após a semana biden onde o mercado se mostrou favorável para compra, indo em desencontro a ideia de muitas pessoas.
Após uma longa subida, papel ultrapassou ultimo topo do mercado pôs pandemia, R$24,23.
Hoje, dia 19/11/20, após uma queda de 3,07% papel vem demonstrado pouca força compradora, as 18:08 papel fechando quase que negativo a 0,2% de alta.
Fica um candle feio no diário, famoso martelo invertido ou uma "estrela cadente".
Pensando em um swing trade, operando na ponta vendendora o papel pode apresentar entrada no dia de amanhã na superação da minima do dia de hoje.
Vamos acompanhar o papel e ver a confirmação do sinal.
Outro sinal importante é a diminuição do volume e uma negação de topo no BMFBOVESPA:IFNC , que está fazendo a mesma figura gráfica que no dia 23/10, sofrendo uma grande queda após isso.
Vamos seguir acompanhando o papel, bons trades a todos.
Metas e Limites.
Boa noite.


BANCO BRADESCOBRADESCO SEGUE NO MOVIMENTO DE ALTA ESTA PRÓXIMO DE ULTRAPASSAR A MD200 ESTA CAMINHANDO PRA FIBO DE 50% R$24,00 MEU ALVO E O 100% DA FIBO R$32,08
