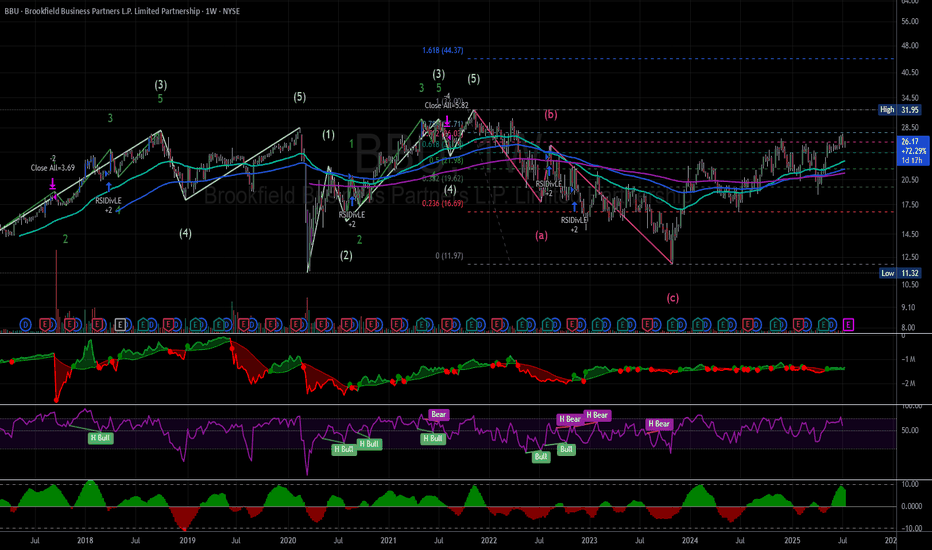
Late Phase D✅ Current Phase Late Phase D (Approaching E)
📍 Resistance Zone $31.95–34.00 (prior high)
🔁 Ideal LPS Area (If pullback) $25–26 (0.618 Fib + MA cluster)
🎯 Extension Target $44.37 (1.618 Fib from 2020 low–2021 high)
🧠 Next Action Watch for breakout above $34 with volume for Phase E confirmation and start of full markup
BBU trade ideas
Stock Near Key Support:Head and Shoulders Pattern Developing?NYSE:BBU
The stock is currently trading at $21.55, just above a key support level formed by the lower boundary of an ascending parallel channel. This channel has been intact since the lows of October 2023, and the current price is testing this critical level.
Head and Shoulders Pattern Formation
A head and shoulders pattern is developing, suggesting a potential reversal. This classic pattern typically signals a shift from an uptrend to a downtrend.
Neckline Support: The fractal support at $21.12 is key. A breakdown below this level would confirm the pattern.
Pattern Structure: The head and shoulders pattern consists of a higher peak (head) between two smaller peaks (shoulders). The breakdown occurs when the price falls below the neckline.
Bearish Breakdown and Price Target
Key Support Level: $21.12 (fractals support).
Breakdown Target: A breakdown below $21.12 would confirm the head and shoulders pattern and trigger a move lower. The target for this pattern is approximately $16.92, which represents a 19% decline from the neckline.
Trading Strategy
Watch for Breakdown: Pay close attention to the $21.12 level. A break below it will confirm the bearish pattern.
Set Stop-Loss: A stop-loss above the $21.12 fractal support will help manage risk.
Bearish Trade: If the pattern validates, look for a potential short position with a target at $16.92.
The stock is at a critical point. A breakdown below $21.12 will confirm the head and shoulders pattern, opening the path for a possible move to $16.92. Keep an eye on the fractal support for a potential bearish trade setup.
BBU Clean & SimpleBrookfield Business firm typically invests in business services, construction, energy, and industrials sector. It prefers to take a majority stake in companies. The firm seeks returns of at least 15% on its investments. Partners L.P. is a private equity firm that specializes in acquisition.
This stock has been trading nicely in the channel trend since August of last week. In other words, this stock has been trading in this trend for over a year! Now we're testing key support once again. Considering how long this trend has lasted, this trend is really strong. Therefore, the probability is high that we'll witness another bullish reversal so many times before. On the other hand, be careful if we break below 42.00.


