BX : First Attempt at Silent StockBlackstone has now decided to invest in Europe.
The stock is technically above the 50 and 200 period moving averages.
After leveling the trend line, an increase in volume was also observed.
In that case, holding a short-medium term or opening a long position with a reasonable risk/reward ratio in a small position size will not hurt us.
I have kept the stop-loss a little tighter now because even if the stop level comes in a sudden drop, it can be tried again. If that happens, I will share it as a new idea.
Risk/Reward Ratio : 3.00
Stop-Loss : 132.53
Take-Profit : 141.73
BX trade ideas

BX EARNINGS TRADE (07/24)
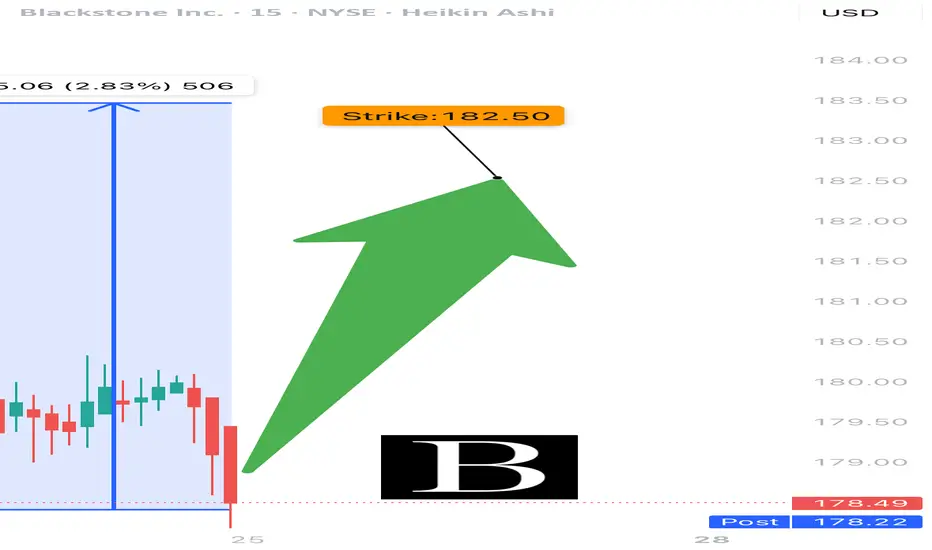
🚨 BX EARNINGS TRADE (07/24) 🚨
💼 Blackstone drops earnings after close — setup looks 🔥 bullish
🧠 Key Insights:
• 📉 TTM Revenue: -8.2%, but Q2 bounce back = $764M profit
• 💰 Margins: Strong → 45.3% operating, 20.6% net
• 📈 RSI: 73.88 = HOT momentum
• 🧠 AUM: $1.2 Trillion = 🐘 heavyweight
• 🔥 Options Flow: Call skew at $182.50 = institutional bullish bets
• 🧮 Expected move: ~5% post-earnings
💥 TRADE SETUP
🟢 Buy BX $182.50 Call exp 7/25
💰 Entry: $0.69
🎯 Target: $1.38–$2.07 (200–300%)
🛑 Stop: $0.34
📈 Confidence: 85%
⏰ Entry: Before Close Today (Pre-Earnings)
📊 IV Rank: 0.75 → options decently priced
⚠️ Watch resistance at $185 — breakout = 🚀
Tight risk, big reward. Pure earnings momentum play.
#BX #EarningsPlay #OptionsTrading #Blackstone #UnusualOptionsActivity #CallOption #TradingView #FinanceStock #InstitutionalFlow #OptionsAlert
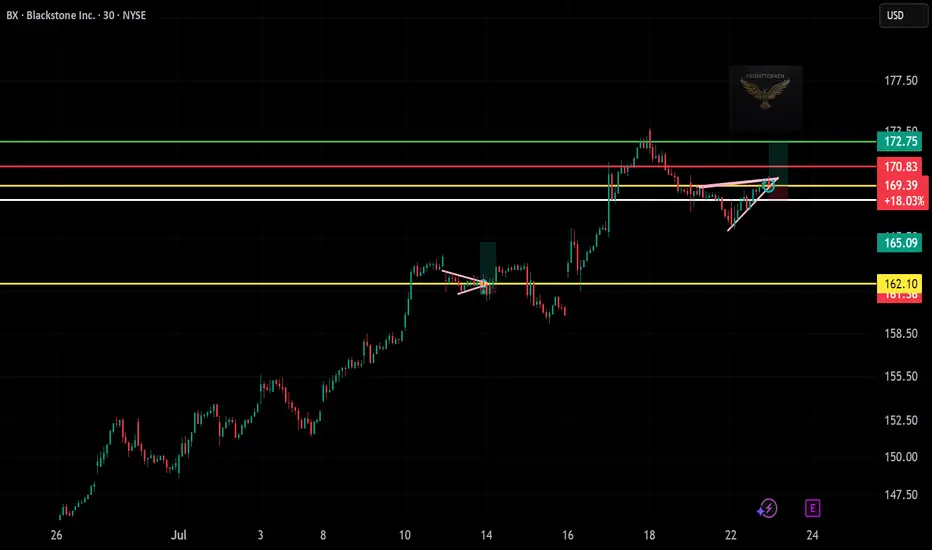
BX (Blackstone) – Long Trade Setup📈
🔍 Pattern: Falling Wedge Breakout + Bullish Flag
📍 Entry: ~$169.39
🎯 Target: $172.75
🛑 Stop: ~$168.20
🧠 Bias: Bullish – Strong support reclaim + momentum building
BX Long Trade Setup!📊
⏱️ Timeframe:
30-minute chart
📍 Technical Highlights:
Bullish pennant breakout forming after a strong uptrend (continuation pattern ✅)
Breakout area: Around $163 (red resistance)
Support held near $162 zone (white/yellow lines)
🎯 Targets:
TP1: $164.15
TP2: $165.05
(Both resistance levels marked in light blue)
🔐 Risk Management:
Entry: ~$163 (after pennant breakout confirmation)
Stop Loss: Below $161.80 (tight risk)
Risk–Reward Ratio: Excellent (>2:1)

Blackstone Leads the Revival of IPOs in Spain Blackstone Leads the Revival of IPOs in Spain with Cirsa and HIP
Ion Jauregui – Analyst at ActivTrades
Blackstone, the world’s largest investment fund, has strongly reactivated the IPO market in Spain with two of its most prominent portfolio companies: Cirsa, a gaming industry giant, and Hotel Investment Partners (HIP), a leader in vacation resorts in Southern Europe. Both companies are in advanced stages of an initial public offering process, following a dual-track strategy that simultaneously explores a market listing or a direct sale to the highest bidder. This strategy offers flexibility to maximize value based on investor demand and market conditions.
This dual-track model involves preparing two strategic alternatives:
An IPO (Initial Public Offering): listing the company’s shares on a regulated market to raise capital or enable shareholders to sell their stakes.
A direct sale (trade sale): selling the company to another fund, institutional investor, or industry player.
This approach allows Blackstone to remain flexible and choose the most profitable or stable option, depending on investor appetite and market timing. It is a common model among major private equity firms looking to maximize returns when exiting mature or high-potential assets. In Cirsa’s case, the traditional IPO route has been selected, involving the issuance of new shares and an overallotment option. For HIP, the final decision between an IPO or a trade sale is still under evaluation.
Cirsa: First to Market
Cirsa aims to raise €400 million in its stock market debut, with a total estimated valuation of €2.52 billion, according to documents seen by Reuters. The company, which operates in Spain, Italy, Morocco, Latin America, and more recently in Portugal and Puerto Rico, will issue new shares at an initial price of €15, with an additional €68 million overallotment option.
The transaction, led by BBVA, Jefferies, Mediobanca, Société Générale, and UBS, would mark the first IPO in Spain since HBX Group's offering in February. It could help revitalize the national capital markets, particularly in leisure and tourism sectors.
HIP: On the Road to the Stock Market
Simultaneously, HIP has completed its transformation into a public limited company—an essential step toward going public. The firm manages 73 hotels with over 22,000 rooms across Spain, Italy, Portugal, and Greece, and is valued at around €6.5 billion. In December 2023, Singapore's sovereign wealth fund GIC acquired a 35% stake, strengthening HIP’s institutional appeal.
HIP’s IPO process is being managed by Citi and Morgan Stanley, with legal advisory from Uría Menéndez. The remaining financial advisors are expected to be announced shortly.
Strategic Rotation Amid a New Real Estate Cycle
In parallel with these IPOs, Blackstone has been carrying out a strategic rotation of its real estate portfolio in Spain, particularly in Catalonia, where both the residential and logistics markets have shown signs of cooling after years of expansion. Regulatory pressure, rental restrictions, and political uncertainty have compressed margins in the residential sector.
In response, the fund has redirected its focus toward the hotel sector, which has proven more dynamic and profitable in the post-pandemic context—marked by record occupancy rates, rising prices per room, and strong international investor appetite. HIP has become its flagship vehicle for this bet, and the upcoming IPO strengthens its long-term commitment to high-quality tourism in Southern Europe.
At the same time, Blackstone has rotated toward the gaming and entertainment sector with its investment in Cirsa; into logistics and industrial assets via platforms like Mileway or Logicor; and has explored infrastructure and energy opportunities, such as renewables, distribution networks, or treatment plants—though at a lower scale than in hospitality.
In short, Blackstone has shifted its attention to more institutionalized sectors tied to tourism or structural consumption, where it can apply its model of active asset revaluation.
Spain Back on the Radar of Global Investors
Blackstone’s simultaneous push for these two IPOs could mark a turning point for the Spanish market, which has seen limited IPO activity in recent years. The success of these listings could open the door to new deals, at a time when demand for European assets is rebounding, fueled by macroeconomic stability and Southern Europe’s appeal in tourism and leisure.
Through these moves, Blackstone not only optimizes its portfolio in Spain but also positions the country as a key destination for major IPOs in Europe.
*******************************************************************************************
La información facilitada no constituye un análisis de inversiones. El material no se ha elaborado de conformidad con los requisitos legales destinados a promover la independencia de los informes de inversiones y, como tal, debe considerarse una comunicación comercial.
Toda la información ha sido preparada por ActivTrades ("AT"). La información no contiene un registro de los precios de AT, o una oferta o solicitud de una transacción en cualquier instrumento financiero. Ninguna representación o garantía se da en cuanto a la exactitud o integridad de esta información.
Cualquier material proporcionado no tiene en cuenta el objetivo específico de inversión y la situación financiera de cualquier persona que pueda recibirlo. La rentabilidad pasada no es un indicador fiable de la rentabilidad futura. AT presta un servicio exclusivamente de ejecución. En consecuencia, toda persona que actúe sobre la base de la información facilitada lo hace por su cuenta y riesgo.

Catalonia Drives Away Residential Real Estate CapitalBy Ion Jauregui – Analyst at ActivTrades
Rental market regulations in Catalonia are triggering a real capital flight among major international funds. Following Patrizia’s moves, Blackstone and Azora have also begun divesting from the region’s rental housing market, prioritizing unit-by-unit property sales amid growing legal uncertainty.
From Investors to Sellers
Blackstone (NYSE: BX) has started informing tenants that lease agreements will not be renewed upon expiration, choosing instead to gradually sell off its properties. This strategy, executed through subsidiaries such as Testa and Fidere, is a response to the negative effects of government intervention: rental price caps, increased tax burdens, and a widespread sense of regulatory unpredictability. German firm Patrizia (XETRA: PTZ) had already initiated the individual sale of over 540 apartments in the Barcelona metro area, coordinated by JLL. Azora, meanwhile, has taken a similar path, offloading part of its residential portfolio through direct sales to individuals.
Regulatory Blow to Real Estate: Supply Drops, Prices Surge
According to data from the Rental Observatory, the Housing Law and other regional measures have led to a 16% reduction in supply in just two years—more than 120,000 units disappearing from the market. At the same time, demand has surged 202%, pushing the number of rental applications per unit from 37 to 112 in just ten days and driving average rent prices up from €906 to €1,146 per month. This imbalance affects not only institutional funds but also the 95% of the market held by private landlords, many of whom are now shifting their properties to vacation rentals, direct sales, or simply keeping them vacant.
Fundamentals: Profitability, Dividends, and Outlook
Blackstone (BX), with a market cap of over $160 billion, is the world’s largest alternative asset manager, overseeing more than $1 trillion in AUM. Its annualized dividend exceeds 3.3%, supported by a strong structure of performance and management fees. The current P/E ratio is around 46x, pricing in future earnings growth as real estate operations and deal flow resume.
In contrast, Patrizia SE, managing around €56.4 billion in AUM, trades at more conservative multiples: a P/B ratio of 0.67x and a dividend yield close to 4%. While its revenues fell 15% in 2024, the company managed to grow EBITDA and maintain a rising dividend policy—a notable achievement amid Europe’s real estate slowdown.
Both companies are transitioning toward infrastructure, digitalization, and ESG solutions, diversifying away from traditional real estate exposure.
Technical Analysis: What Do the Charts Say?
Blackstone (BX) is currently trading near $152, having rebounded from May lows (~$115). The stock displays a sideways-upward structure, with key support at $133.25 and resistance around $157.95. The current range sits between $133.25 and $152. RSI is in overbought territory at 68.17%, with a positive bias if volume breaks above the current resistance. The point of control is around the consolidation zone at $140.49. The 50-day moving average has crossed above the 100-day average; the 200-day cross is still pending to confirm a sustained uptrend.
Patrizia SE (PAT.DE) is trading around €8.26 in early hours, rebounding technically from yearly lows around €6.15. Its current range fluctuates between €6.85 and the €9.20 highs. It recently broke short-term resistance at €7.80, now a key support. RSI shows slight overbought at 54.23%. The point of control lies near €7.82, and the moving averages are forming a bullish golden cross, suggesting short-term consolidation before a potential push toward €9.20 or even €9.40.
Which Is the Stronger Bet for 2025?
Blackstone, with global exposure, financial strength, and the ability to capture structural trends (AI, infrastructure, tech REITs), represents a more aggressive sector outlook. Patrizia, on the other hand, offers a more defensive, Europe-focused opportunity—ideal for investors seeking stable yield and real assets with minimal leverage.
Both are valid plays, but investor risk profile is key: BX moves with the market cycle, while PAT may offer shelter amid volatility.
Madrid, Valencia, and Málaga Step In
As Catalonia loses its appeal for residential investment, Madrid has emerged as the new capital magnet, quadrupling Barcelona’s investment levels since 2023. Valencia and Málaga are also gaining ground on institutional radar, offering more stable legal environments for portfolio development. Rental regulation in Catalonia has further strained an already fragile market. With major funds like Blackstone, Azora, and Patrizia pulling out—and pressure mounting on supply—the Catalan model faces a critical crossroads between tenant protection and investment sustainability.
*******************************************************************************************
The information provided does not constitute investment research. The material has not been prepared in accordance with the legal requirements designed to promote the independence of investment research and such should be considered a marketing communication.
All information has been prepared by ActivTrades ("AT"). The information does not contain a record of AT's prices, or an offer of or solicitation for a transaction in any financial instrument. No representation or warranty is given as to the accuracy or completeness of this information.
Any material provided does not have regard to the specific investment objective and financial situation of any person who may receive it. Past performance is not reliable indicator of future performance. AT provides an execution-only service. Consequently, any person acting on the information provided does so at their own risk.

Black Stone Stock Chart Fibonacci Analysis 050925Trading Idea
1) Find a FIBO slingshot
2) Check FIBO 61.80% level
3) Entry Point > 129/61.80%
Chart time frame: D
A) 15 min(1W-3M)
B) 1 hr(3M-6M)
C) 4 hr(6M-1year)
D) 1 day(1-3years)
Stock progress: A
A) Keep rising over 61.80% resistance
B) 61.80% resistance
C) 61.80% support
D) Hit the bottom
E) Hit the top
Stocks rise as they rise from support and fall from resistance. Our goal is to find a low support point and enter. It can be referred to as buying at the pullback point. The pullback point can be found with a Fibonacci extension of 61.80%. This is a step to find entry level. 1) Find a triangle (Fibonacci Speed Fan Line) that connects the high (resistance) and low (support) points of the stock in progress, where it is continuously expressed as a Slingshot, 2) and create a Fibonacci extension level for the first rising wave from the start point of slingshot pattern.
When the current price goes over 61.80% level , that can be a good entry point, especially if the SMA 100 and 200 curves are gathered together at 61.80%, it is a very good entry point.
As a great help, tradingview provides these Fibonacci speed fan lines and extension levels with ease. So if you use the Fibonacci fan line, the extension level, and the SMA 100/200 curve well, you can find an entry point for the stock market. At least you have to enter at this low point to avoid trading failure, and if you are skilled at entering this low point, with fibonacci6180 technique, your reading skill to chart will be greatly improved.
If you want to do day trading, please set the time frame to 5 minutes or 15 minutes, and you will see many of the low point of rising stocks.
If want to prefer long term range trading, you can set the time frame to 1 hr or 1 day.

What is a war chest and lessons we can learn from Blackstone...In case you haven't heard, NYSE:BX is hogging over $100 billion of dry powder that is ready for deployment at the snap of a finger. Now, just because we cant get our hands on hundreds of billions of dollars doesn't mean that we shouldn't have a war chest of our own.
Why a war chest is a must have
Firstly, having dry powder ready for the next trading day could be the determining factor of a make or break trade. Specifically think back to when the current market downturn started. If I had to guess, many of you reading were far too exposed to the market and got scared from the "red wave" that shocked the market heatmaps. I would also like to bet that many of you sold positions for a loss to stop the bleeding and are now looking for a better entry. However, consider what would have happened if you had spare cash on your side to keep your positions alive.
Here is an example of over exposure.
And here's an example of keeping about a 20% war chest by your side...
I understand that it seems like a small amount of money, but trading is a game of pennies and a winning position of pennies is much better than a losing position of $140. This is the same tactic that firms like Blackstone use to protect large positions from poisonous events such as this recent downturn in the market. So in order to make money like a bank, we need to learn to think like a bank...

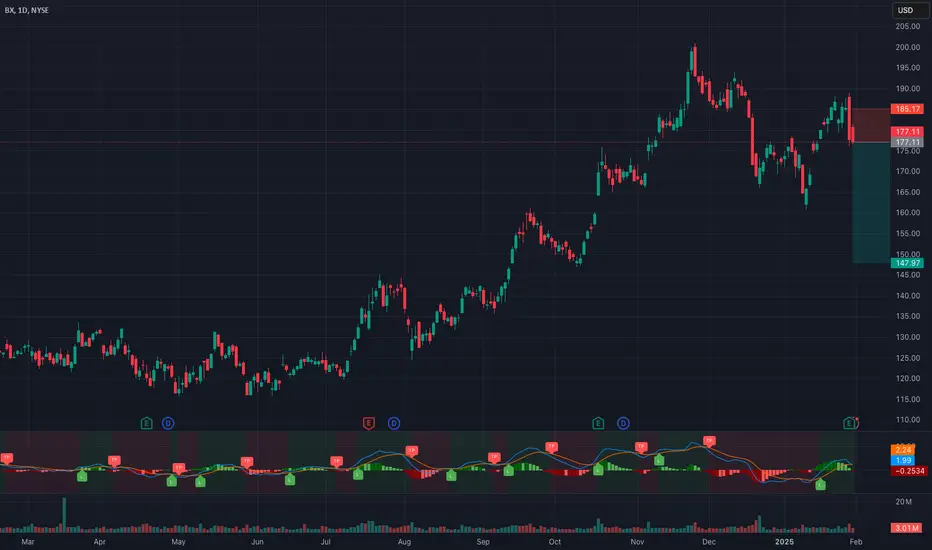
BX, double bottomBlackstone has recorded a double bottom at $119 and a fake bullish crossover lately.
Now it is approaching a new bullish crossover and is working to create a new relative high that would create a good positive price action.

BX - Liking it Under 120I've been nibbling on BX as it is continuing to maintain in a possible upward channel. Looking for an eventual move above 200 once this minor cleansing shakes out. They can do Real Estate much better than I.

BX BounceLooks like BX just found support 158. There's an upper trend line that seems to be drawing price back up to. 180 price target looks reasonable to reach. GL!
Speculative Madness: The Market’s Bubble Stocks Some stocks areSpeculative Madness: The Market’s Bubble Stocks
Some stocks aren't just overvalued—they're in full speculative bubble mode. Fundamentals? Irrelevant. When euphoria takes over, rationality disappears.
Here’s my list of bubble stocks that scream unsustainable pricing:
SBUX, T, PLTR, BMY, PYPL, NFLX, GS, ISRG, ARM, C, SHOP, BSX, SPOT, UBS, IBKR, RELX, CEG, CRWD, MSTR, MMM, DASH, COF...
And let’s not forget the obvious: TSLA, META, AMZN, AVGO, GOOGL, JPM, MA, V, WMT.
Honestly, the entire banking sector, brokers, and tech are in bubble territory.
What the hell is going on with this market? Why are algos just buying, buying, buying, squeezing all the shorts?! Unbelievable.
The dump will be insannnnnnnne!!! 🚨
$BX LONGThis is a weekly for BX. In the Fibonacci framework I use to determine discount vs premium, it just hit the 71% retracement level indicating a good discount in the uptrend. Also of note is the 2 bar bullish engulfing reversal formation, indicated by the green oval. I hold this as a long-term investment in my IRA and would add now based on this price action.

Blackstone Inc. Targets $256: Strong Momentum Backed by Volume Blackstone Inc. (BX) highlights a strong bullish structure, with the price targeting the key resistance zone at $256.10, as indicated by the arrow projection. The significant volume accumulation in the range of $90-$150, shown in the volume profile on the right, suggests robust buying interest and a strong foundation for the upward trend. The price is maintaining its trajectory well above the previous consolidation zones, reflecting buyer strength and momentum. Additionally, the lower momentum oscillator shows a positive divergence, reinforcing the possibility of continued price appreciation. With the trend supported by historical levels and strong volume, the stock appears well-positioned to test and potentially break through the $256 resistance.

How I look for entryKeep in mind that all of what you see is not what I draw up when looking for an entry. With a little practice you can just see the lines without the drawings. All text, colors, drawings are to explain what I see.
Keep your charts clean. Blk & Wht, using as little as possible to see the chart clearly.
Using BX, 15m, today as an example. Once you see it in the algo it can not be unseen. Support and resistance is the same on any timeline on any chart.

Long entry $BXFriday on the rebound I got an alert that NYSE:BX had reached a discount level, based on my Fibonacci Retracement methodology. I waited until later in the session when it became likely that it would have a strong close/candle and entered, adding to my holdings in my IRA. This is a long term investment and I considered it a great place to add the premier alternative asset manager at a great price. If you like these ideas look for me on MrJosephTrades on X (formerly Twitter). Great trading, everyone...

BX Blackstone Options Ahead of EarningsIf you haven`t bought BX before the previous earnings:
Now analyzing the options chain and the chart patterns of BX Blackstone prior to the earnings report this week,
I would consider purchasing the 160usd strike price Calls with
an expiration date of 2025-6-20,
for a premium of approximately $13.90.
If these options prove to be profitable prior to the earnings release, I would sell at least half of them.

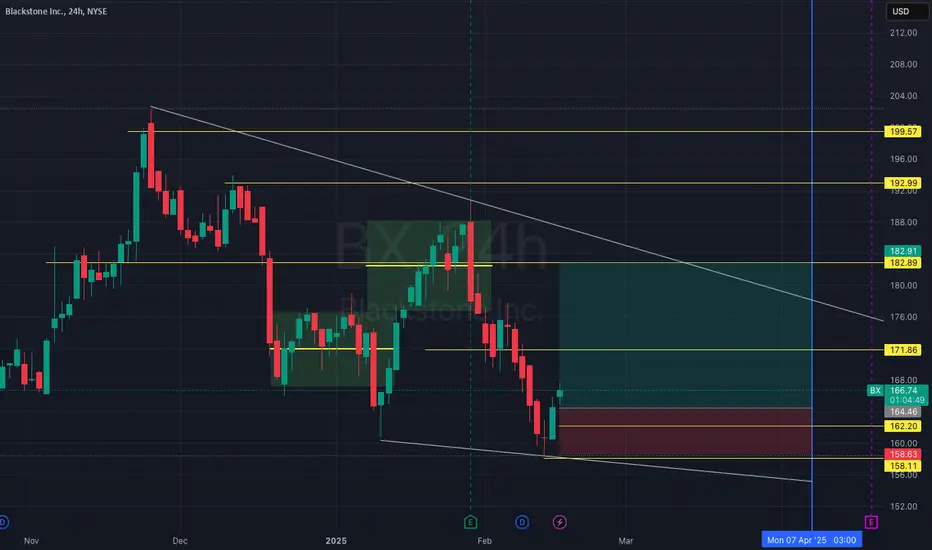
Lower OpeningWithin an short term overbought market it becomes clearer that there will be a downward correction. The short candle body of the past 4 hours could not stop the dwindling corrective bias. The new 4h-periode has opened lower.

$BX Breaking out BX looks to be breaking out from a trendline.
RSI breaking over 60, rising 55D SMA.
Stop Loss: 131.82
Target: 160.91
Note: This analysis is strictly for educational purposes only and is not a buy/sell recommendation.

BX Blackstone Options Ahead of EarningsAnalyzing the options chain and the chart patterns of BX Blackstone prior to the earnings report this week,
I would consider purchasing the 140usd strike price Calls with
an expiration date of 2024-10-18,
for a premium of approximately $6.70.
If these options prove to be profitable prior to the earnings release, I would sell at least half of them.

Median Lines and Finding the Right Path When it comes to learning about markets and trading, finding the right path and committing to it is the hardest part. The right path has little to do with any technical analysis method. It has to do with structuring our mental framework so that we fundamentally change how we experience markets, trading, and loss.
In the video, I show some Median Line and Action/Reaction work but this work is useless by itself. No tool is good or bad, they are just tools we use to comprehend markets. The problem arises when the tools start using us and we think there is some kind of magic to them.
The essence of our strategy should be to structure our methods and mindset towards functionality. The journey we should commit to is one marked by fostering accountability and responsibility in all our actions. The swing trade Idea I show, takes method and structures it into function.
Shane

Time to comeback on BlackstoneCrossing up several moving averages, RSI moving up, Relative Volume up, all after a double bottom. Looking good.

Blackstone CALLThe price settled on the demand zone appears to confirm the trend reversal with current jump in price. Expecting the price to test $125, and if successful, to test $131
