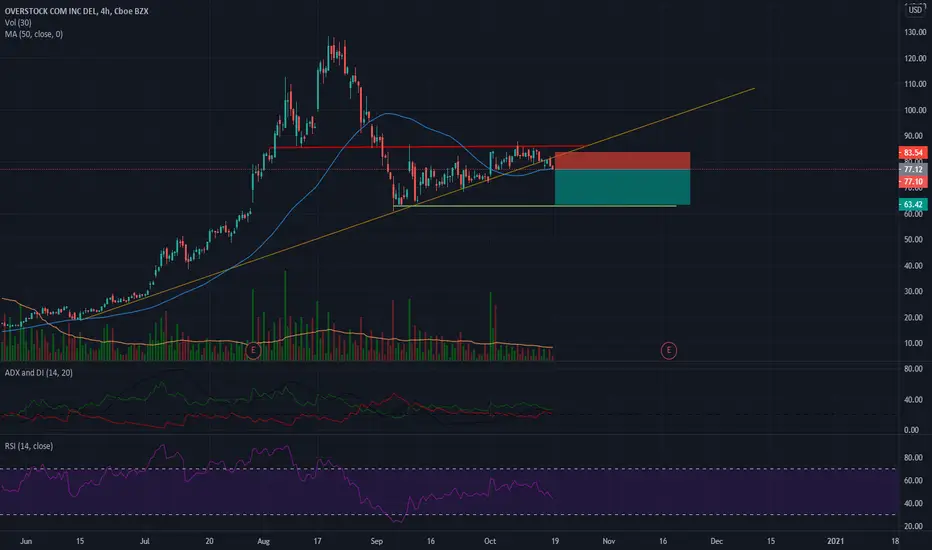
OSTK short ideaOSTK break uptrend line.
Now got support on 50MA. in case it will break down the 50MA, it will trigger a short position with 1:2 risk-reward ratio.
take profit @64
stop loss @84
BYON trade ideas
$OSTK - call optionLooking for some gains in November with 1/15/2021 expiration
$80 strike - cost is $1750
Watching for $110 share price to sell for 96% gains. Estimated sale date - mid to late november, but can hold into december if necessary
Assumption: holiday season is positive


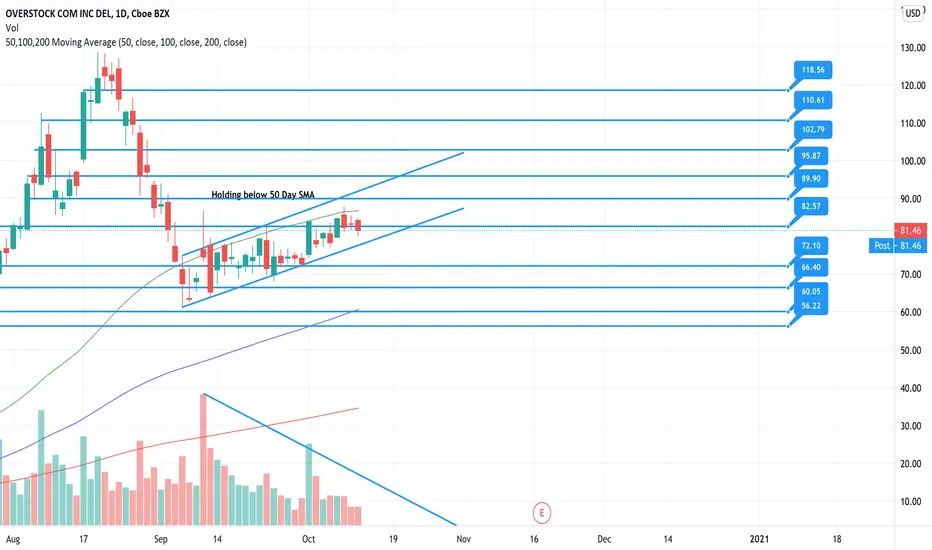
OSTK Losing MomentumNASDAQ:OSTK Has lost its upward momentum. As this stock begins to form lower highs, and holds the 50 day SMA as resistance it could break its upward trend channel. If it holds below 82.57 I believe it could retrace to the 72.10 if the trend channel is broken on the downside. However, a couple of strong bullish days and a break of 89.90 could prompt more buyers to step into the market and cause a test of resistances.

great adds at 40 it was a good alert earlier this year ! think over 90-95 we can see highs again. Gl <3


OSTK - screaming bullish chartOSTK comes back in play
Consolidatied nisely, now breaking out from a wedge.


OSTK Bullish Momentum (2-Hr chart)OSTK seems to do well whenever bitcoin does. So, its not so market dependent. I'm hoping for $100.
I would put a stop on weakness below upward trendline. But I would buy additional if dropped to trendline and looked strong off it.


OSTK - consolidation triangleNASDAQ:OSTK crossed the consolidation triangle 2 days ago, a pullback happend 1 day ago, the TVC:NDX was really weak, so the pullback was compulsory. Above 84,5 $ a pro cyclical buy signal is triggered.
ADX is low, +DI ist positive
RSI is slightly overbought


OSTK Triangle break and bounce at support?We just broke the triangle to the upside and seems to get a bounce at the new support? i'd look to long here with a tight stop.

Ride the Rally of OSTKOSTK is getting over its early accumulation stage.
It is a consolidation at Fibonacci 50% with high volume, significant volume is adding up the fuel for incoming rally.
1. the previous gap up has good support zone, that was well being respected since that.
2. Point of control is an evidence of high volume cluster, where accumulation stage has held.
3. Fibonacci retracement 50%
Let's FLY...


OSTK, enters Downtrend as Momentum drops below 0 level 09/30/20This indicator may be signaling that OSTK's price has further to drop, since it fell below its price logged 14 days ago. Traders may consider selling the stock, shorting the stock, or exploring put options. Tickeron A.I.dvisor backtested 91 similar cases where OSTK's Momentum Indicator fell below the 0 level, and 74 of them led to a successful outcome. Odds of Success: 81%. Current price $80.60 is above $22.30 the highest support line found by Tickeron A.I. Throughout the month of 08/28/20 - 09/30/20, the price experienced a -25% Downtrend, while the week of 09/23/20 - 09/30/20 shows a +2% Uptrend.
Bearish Trend Analysis
The Momentum Indicator moved below the 0 level on September 30, 2020. You may want to consider selling the stock, shorting the stock, or exploring put options on OSTK as a result. Tickeron A.I. detected that in 74 of 91 cases where the Momentum Indicator fell below 0, the stock fell further within the subsequent month. The odds of a continued downward trend are 81%.
The 10-day Moving Average for OSTK crossed bearishly below the 50-day moving average on September 14, 2020. This indicates that the trend has shifted lower and could be considered a sell signal. Tickeron A.I. detected that in 11 of 11 past instances when the 10-day crossed below the 50-day, the stock continued to move higher over the following month. The odds of a continued downward trend are 90%.
Following a 3-day decline, the stock is projected to fall further. Considering past instances where Apple declined for three days, the price rose further in 50 of 62 cases within the following month. The odds of a continued downward trend are 84%.
OSTK broke above its upper Bollinger Band on August 17, 2020. This could be a sign that the stock is set to drop as the stock moves back below the upper band and toward the middle band. You may want to consider selling the stock or exploring put options.

Ascending Triangle for OSTK?Since my previous post on OSTK linked to this chart we have seen some support on the KST & a bounce back into the descending channel.
Where I had a question mark before on the KST is now another blue finger icon representing a micro bottom.
The RSI has additionally bounced back into what was a descending triangle, it's possible we see this play out as a bullish flag or inverted H&S, I've placed a blue body to represent the head of the pattern, notice the right shoulder is squeezing into the end of the descending triangle.

$OSTK Trade Idea Trade Idea: OSTK $80 Call 10/02.
MACD diverging almost to the upside. It received a bunch of upgrades as well and held well during sell off this week.
SPX as long as it holds $3230 idea is still valid. I think we see upside on $SPX.

$OSTK... ugh$OSTK continues its absolutely wild swings. Remember, this is an internet retail company that has lost money since inception and has continuously tapped shareholders to fund its crypto ventures.
With Bitcoin price not going anywhere, the stock has no real catalysts and after its precipitous recent fall from $127, seems stuck between $60 and $80.
Only for day trading.

Bouncing around the rangeOSTK has been within a wide ~$10 range for most of September. Playing a 15% range like this on a low-cost stock can be profitable. I intend to keep selling in the high 70s and buying in the mid/high 60s until proven otherwise.

Bear Flag in OSTKLooking like a continuation pattern for OSTK. Having some trouble getting above the 50-day moving average. Good short opportunity
