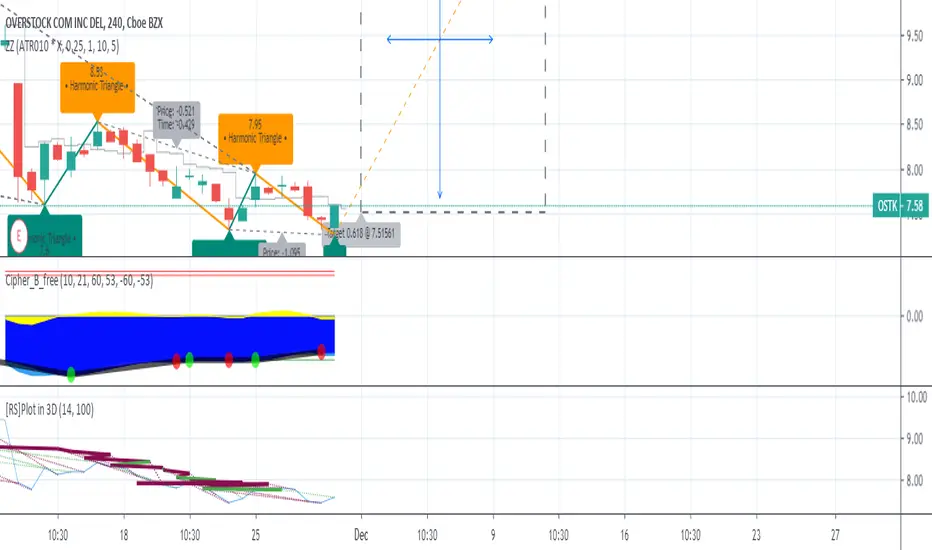
Is OSTK trading in a Ascending Triangle?It appears as though $OSTK is holding support above the 200 Day MA & potentially trading in a Ascending Triangle.
The trendlines of a triangle need to run along at least two swing highs and two swing lows.
Ascending triangles are considered a continuation pattern, as the price will typically breakout of the triangle in the price direction prevailing before the triangle. Although, this won't always occur. A breakout in any direction is noteworthy.
A long trade is taken if the price breaks above the top of the pattern.
A short trade is taken if the price breaks below the lower trendline.
A stop loss is typically placed just outside the pattern on the opposite side from the breakout.
A profit target is calculated by taking the height of the triangle, at its thickest point, and adding or subtracting that to/from the breakout point.
BYON trade ideas

Overstock On breakout watch $ostk
Earnings after hours for this extremely volatile stock .
Risky to to trade into the event but if so desired, the stock is quite bullish,
RSI in strong uptrend,
Moving averages acting as support and rising.

OSTK Round UpOSTK, has been trending up as of late with $9.5 showing some solid resistance. OSTK is famous for selling off in the second half of the day. So if this 9.40 gets reached its an immediate sell. Could happen as soon as today or tomorrow.


OSTK Cup buildingLooking for a pullback with a Higher Low put in. Then we wait for the launch as the shorts get squeezed!!

$OSTK setting up to double in price from the lows after reversalPeople got overly pessimistic on OSTK, taking it down to $6.60. Q4 should look a lot better judging by housing numbers and positive retail indicators.

$OSTK green shoots?We are starting to see some signs of life and it seems that it does not want to go to the 6s and 5s, but it is too early to go long.
There are a few short term (positive?) catalysts:
- End of tax loss selling and portfolio repositioning (1Q)
- Digital dividend (mid February)
- Next earnings (mid March)
If Bitcoin cooperates and it manages to get into the 9s again, the run up would resume


Long... Watch open, possible runner into 9's. Nice swing tradeLong... Watch open, possible runner into 9's. Nice swing trade. See above gap and double bottom with slow curl up reversal.

OSTK enters buy zoneIf OSTK can hold the support at 9.50, we can expect a big profit.
Stop loss: 9.00
Target 1: 12.00
Target 2: 14.80
Target 3: 18.90


Overstock Com Inc (Forecast)Buy In: $6.50 - $9 range - 19/11/01 - 19/11/19
Target: $28 - Forecast: 20/03/20


$OSTK div dates will soon start to drive priceUnusually $OSTK bottoming process commonly coincides with periods of lower volume.

Double bottom around 9.40 ?Not trading advice as I am still learning, but from what I gather I believe this will ride the red line down to double bottom barring good news, once double bottomed potential for 25-30% on bounce, news of trade deal or higher guidance from 36 hour sale maybe give enough momentum to push up to the 14.50 range. Double bottom forming on the weekly as-well.

OSTK Swing Trade IdeaWaited for OSTK to come back to the 9.4 - 10.4 range and with the strong reversal and MACD cross on the daily - historically this has been a strong indicator, at least as of recent.
Lots of concern still around this entire company and the day or day operations coupled with their vision / side investments but worth it for a small swing with the rest of the market being dragged down by political / international concerns. Tight SL set w/ entry at 10.4....
Trying to make some dry powder in a sea of red can be dangerous but past 48hrs has shown incredible strength, let's just hope it continues.
PT1: 14.5
PT2: 21.10
PT3: 26.79
Will trim as we move up or let the SL do its job. Trade wisely - GLTA

Risky long trade Setup in Overstock.Entry level $113 = Target price $132 = Stop loss $109
Extremely risky trade in a very volatile stock.
Tom Forte of D.A. Davidson.
"You have a very volatile stock that has had recent peaks and valleys .Investors are trying to determine what the assets are worth and the stock is starting to rebound."
Now that the dust has settled a little, the company has more distance from the former CEO and people are starting to reassess the story here on its merits.
He has issued the stock a BUY rating and a $48 price target.
Short interest 33% Could be a catalyst
Company profile
Overstock.com, Inc. operates on online shopping commercial site. The firm also sells these products through www.overstock.com, www.o.com, and www.o.biz. It operates through the following business segments: Retail, tZERO, and Other. The Retail Segment engages in e-commerce sales through its website. The tZERO Segment focuses on securities transaction through its broker-dealers. The Other Segment consists of Medici business. The company was founded by Patrick Michael Byrne on May 5, 1997 and is headquartered in headquartered in Salt Lake City, UT.

OSTK BounceOSTK has been sold down to a major support level that it has only seen once before. After reaching this level, there was a green daily candlestick hold leading me to believe this support level is a bottom and will create a bounce to the $13 range. My stop alert will be set for $9 area if invalid.

Still room to short OSTK - further downside until $9OSTK has been inundated with negative news since founder and former CEO Patrick Byrne stepped down in August. The stock has seen some intense volatility.
Shorting the stock has proven profitable recently. There is still time to be short, despite the heavy losses already sustained.
On September 16th, OSTK plunged through its 9-Day MA and has been in freefall ever since. There is nothing keeping it from falling further until long-term support at $9.00.

Great Potential 20%+ Return on OSTKOSTK has shown a horizontal trend over the past couple months and has reached a strong support at about 14.50. Great low risk buy opportunity for a potential 20%+ return.

