Pulling out of overstockAs we approach the 200 day and the $20 level I am closing this trade. still looks bullish but I am happy .
BYON trade ideas


Overstock.comAvalement mensuelle haussier ---> Stop sous la bougie; tp1 mm20 mensuelle vers 30; TP2 BB haute mensuel vers 59 usd sur price action.


Bitcoin Down Big, But OSTK Green. Massive Volume Spikes. LongThe fact that all the other bitcoin stocks are down says a lot about the strength of OSTK. Looks great for an entry today. Medium size, 1/2 -- now
Will be updating with more details

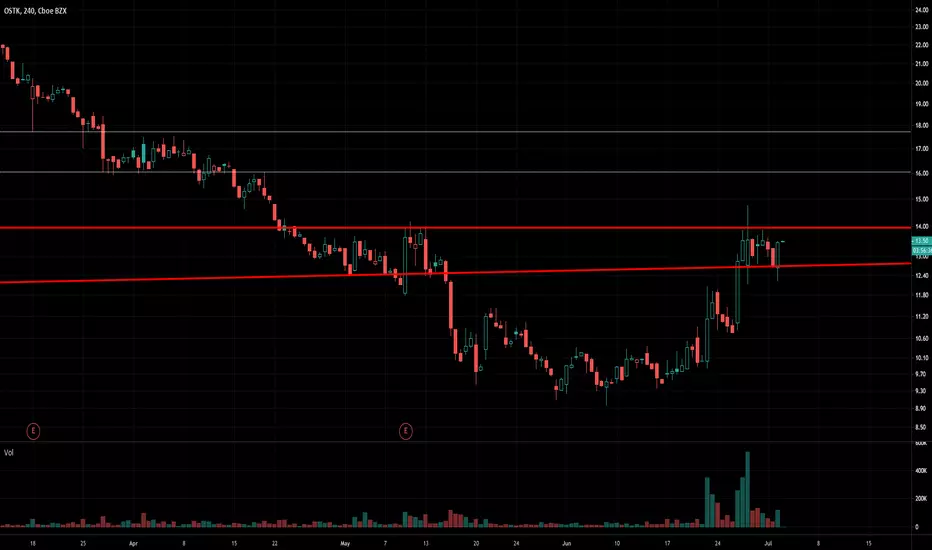
$OSTK higher high on higher volume E2E would would be $16 #tZEROThe RSI is showing there is a lot of room to run. The next target is $16. Support is at $12.

Anouther possible crypto play BTCOverstock 's chart is similar to the crypto and might be another options with a good ATR

OSTK long ideaLooking at OSTK it may be finally time to buy. The 4hr chart shows the price breaking out and higher than all significant moving averages. Notice how the price has been below the moving averages until lately. Im looking for the trend to change and move higher. Set your stops in case this fails.

OSTK - LONG OVERNIGHT
OSTK - Overnight hold nice hold on to gains here today and a really night pull back closing a little below high of day.
Best volume out of the biggest % gainers would really like to see a morning spike on monday morning would be in for a weekend hold 11.47
Buy the rumor of a retailer deal , today there was speculation of a retailer deal My guess is this is likely to shot up with a slight uptrend from 20 may low of 9.00s this has history of spiking and holding on unusual volume this would be a great play here going for singles I would be long overnight at 11.47 buying near close

Massive Inverse Head & Shoulder on a All Time Frame!Whoa, this may end up going Very, Very, Very Parabolic in the next few years.

IS THERE LIGHT AT THE END OF THE TUNNEL IN OVERSTOCK.?It has come to light that several suitors are now in play to take over the retail division, thus the rally in the stock today, which was at EXTREMELY Beaten down level. THE STOCK ALSO CARRIES A INCREDIBLE 65% SHORT INTEREST, and is just about the most expensive stock to borrow.
"Two very attractive acquirers that I would have put high up on my list have shown up, CEO Byrne told CNN today.
SHORT INTEREST 65%
COMPANY PROFILE
Overstock.com, Inc. operates on online shopping commercial site. The firm also sells these products through www.overstock.com, www.o.com, and www.o.biz. It operates through the following business segments: Retail, tZERO, and Other. The Retail Segment engages in e-commerce sales through its website. The tZERO Segment focuses on securities transaction through its broker-dealers. The Other Segment consists of Medici business. The company was founded by Patrick Michael Byrne on May 5, 1997 and is headquartered in headquartered in Salt Lake City, UT.

$OSTK up over 13% since Mex tariff lows. Bullish RSI divergence.A higher low and a higher high would confirm that the bottom is in.
Nasdaq just made a higher daily high and the S&P 500 is back above the 200MA.

$OSTK failing to make new low after 8 days of lower $NDX #tZEROPatrick Byrne's stock sale to cover personal obligations induced capitulation in the stock price. Subsequent insider stock purchases have made it clear that this was not a sale induced by anything other than debt obligations.
As seen in the chart, mean reversion is overdue and probably being held back by a continued downtrend in the entire market. With the S&P 500 touching down on the 200-day MA yesterday a bounce in the market could cause OSTK to rebound much more (in percentage terms.)
The Kijun is a measurement of mean price over time, the stock price of OSTK usually only strays this far from the mean at the bottom of capitulation. A rebound could mean a 33% to 50% bounce from the lows. It is currently just above the lows after many days new market lows.

OSTK bottom could be inBottom in OSTK could be in. Showing Positive divergence on RSI, rising volume and Finding support of monthly and Yearly pivots. OSTK is approaching very depressed levels however, so I would place stops below recent lows.

Could Survive, But No Promise...!I made my worst trade after opening a long position of OSTK when it was ~$80.00 back in early 2018. I scaled in and out a couple of times, but after all, I was fed up and liquidated all my positions around $50.00 - $60.00. It was just nasty. AND this stock has just gone worse day in and day out ever since. Everything aside, I think the trend could reverse if the price remains within ~$10.00 to ~$9.00, but the chart has to scream TREND REVERSAL. $10.00 is the closest support level which would also act as a psychological level for the price. Nevertheless, I anticipate that the price touches this level soon, but the main point is to see a decreasing bearish momentum and exhaustion for sales. For that, I would like to see things like divergence, range-based consolidation, or a washout volume. If the trend reversed, first resistance would be ~$14.00. The trend is unarguably down and the price is just sitting at the bottom boundary of the bearish channel. I did draw some patterns as I was trying to figure it out, but nothing really appealed me; It still needs time to develop. Bearish momentum is decreasing in the short-term charts but still not in the long-term.
Stay tuned...

What $OSTK capitulation looks like, followed by 33% bounceOSTK has seen capitulation many times over the past 15 years. The small float makes it an easy target for mid-tier short sellers who can help it maintain a downtrend relatively easily compared to higher float stocks.
These long downtrends usually end in capitulation, well below the estimated valuation of the company. It is common for there to be a shallow (in dollar terms) Doji candle on either the four hour or the daily chart at the bottom. The bottom occurs below the Bollinger band displayed above.
At $9.30 OSTK will have dropped 60% from the March highs.
At $9 OSTK will have dropped 90% from the highs.
The typical bounce from the bottom of capitulation seen over the following 2 to 3 weeks is a gain of 33%


$OSTK strong reversal pattern on bullish RSI divergence. #tZEROConfirmation comes as the RSI makes it above 50 on multiple timeframes. At the moment it looks very much like a bottom with bullish RSI divergence.
