OSTK doesn't have a competitive advantagesThe financials look good but this business is commoditized. The way they grow profits is by stealing market share and lowering costs. These prospects don't sound very attractive for a long term hold. This might work for a valuation play but not for growth play. I was thinking it was cheap and i should buy it but, now when i think about it i will wait if it falls another 30 40% from here.
BYON trade ideas


Overstock.com, Inc.Overstock.com, Inc. is an American internet retailer selling primarily furniture headquartered in Midvale, Utah, near Salt Lake City. Patrick M. Byrne founded Overstock.com in 1999
caution trend still bearish
buy small
link to VCHART indicator will be published in 12 days due to tradingview restrictions

needs to break back above support first! on my watchlist 🦉ostk temporarily breaking below extreme support, if we can break back above support my targets are 61.12-67.98-80.10.
like and follow for more! 💘

Trend reversal for OSTK 3 Month down trend looking to have found support bullish harami formed looking for trend reversal for confirmation

Overstock - large consolidationPrice is moving sideways on daily/ weekly.
Pattern with a complex wave B
Price collapsed by 50% over the last 30 trading days. It means 100% upside to test the last high!

Long $OSTK using BB's and more!tradingview has this feature called 'bars patterns'. If you believe markets/stocks follow cycles, or behave in similar patterns, see the $OSTK chark. You select a range (purple), tradingview copies it (blue bars) then you move the copied bars to where you'd like. That's baddass trading fun in my world.


Cup and HandlePrice is not to long entry level yet for the cup and handle.
Possible stop under handle low or mid cup/mc.
Short percent is 10.88%.
OSTK broke up from a symmetrical triangle. There is an M pattern forming but the handle low has held so far. If price breaks the handle low, then price may complete this pattern which could possibly land at the .786 or .886. It is hard to guess when there are a few patterns going on as to which one will win (o:
No recommendation
Roll Tide!

$OSTK | WEEKLY WATCHLIST 11/22Pretty uneventful week for this one last week. Plan stays the same, and looking for wave 2 buys below in the $98-103 region targeting $132 ultimately. Staying patient here.
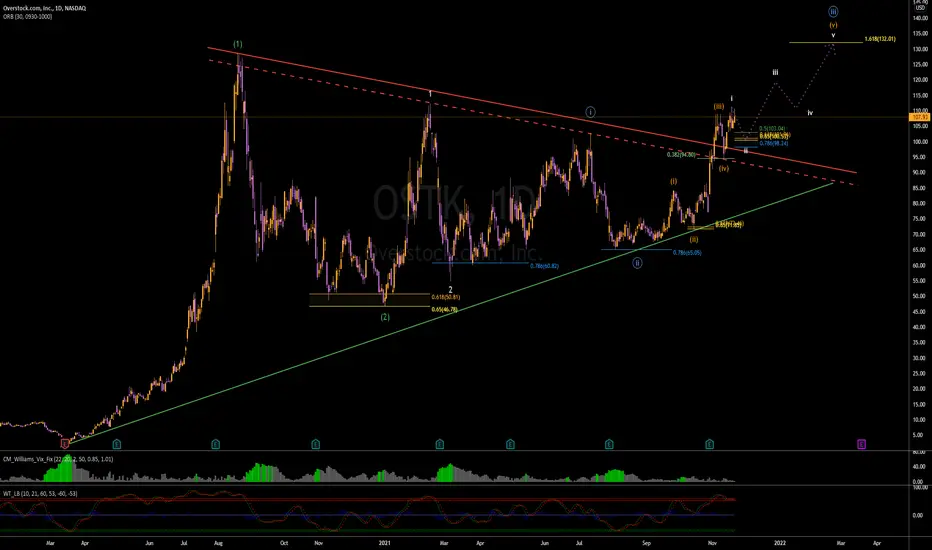
$OSTK | TRADE IDEAExpecting ONE LAST DIP before full send upside. You don't want to miss this, I expect the move to be very quick.
Cup and HandlePrice showing a lot of momentum and is over the top Bollinger band set on 80 SMA. Not overbought on daily, weekly or monthly RSI set on 80. Is overbought on hourly.
Long consolidation period in a symmetrical triangle.
Long entry level can be important. Short percent is 11.76%. Shorties have their faves I suppose and is always on the high side for this security.
Possible stop under handle low of 90.98, or under 90 somewhere. Pocket pivot last formed is a ways under price but you may see support elsewhere.
Can be volatile.
No recommendation.
Chart patterns are a depiction of human emotions. Human emotions can change a lot day to day. Some more than others (o:

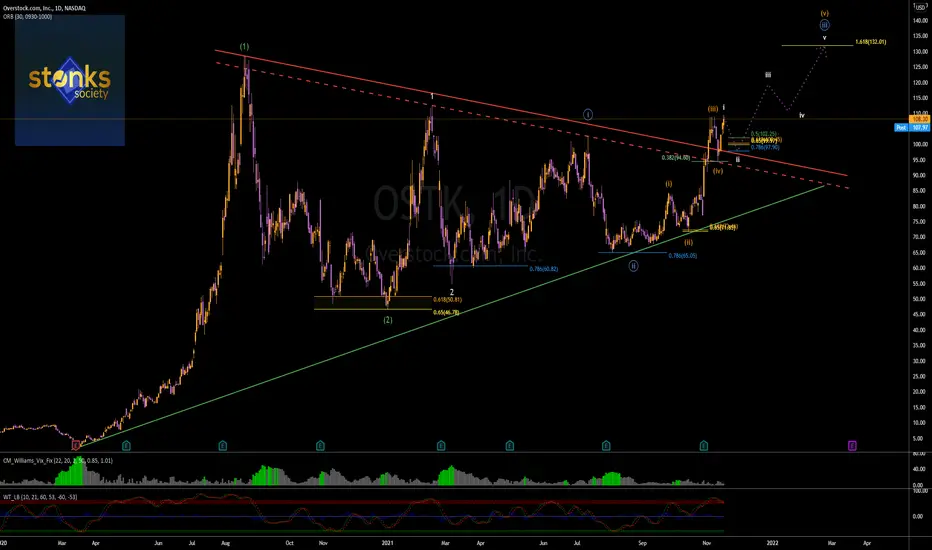
$OSTK | WEEKLY WATCHLIST 11/15Almost time to enter this one!!! Expecting one last small dip to satisfy my bull thesis. I will be buying this dip as long as we hold my levels. This should be a fun one!


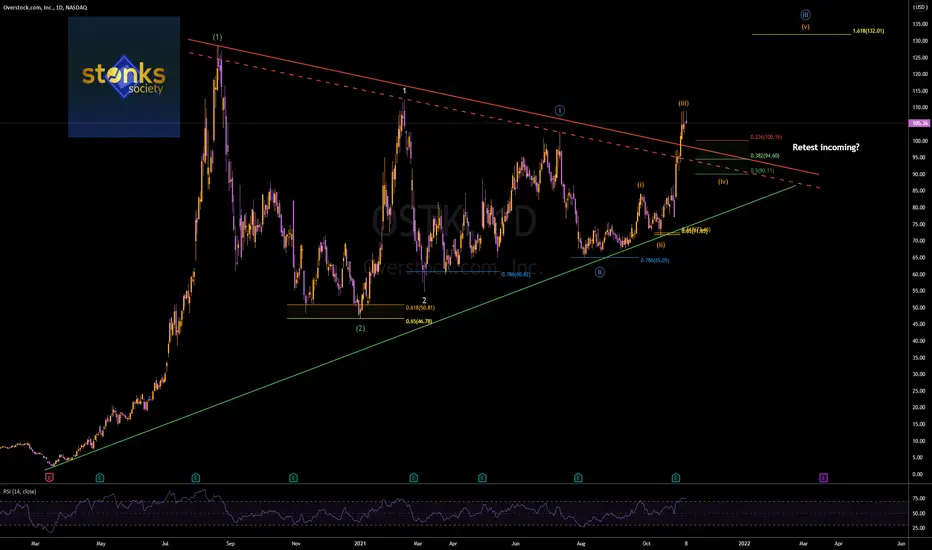
$OSTK | WEEKLY WATCHLIST 11/8One of my favorite swing setups pending. Patience is key here, waiting for the retest for entry.
OSTK ShortDown trend line touch
11/28 earning
Short Entry 93.5
Stop 97
Target 75
Risk management is much more important than a good entry point.
The max Risk of each plan should be less than 1% of an account.
I am not a PRO trader. I trade option to test my trading plan with small cost.

$OSTK Long$OSTK continues to eat market share from $W and P/S should approach 2. This is w/o accounting for the Medici Ventures portfolio providing a potentially large real option at no (close to 0) further cost.

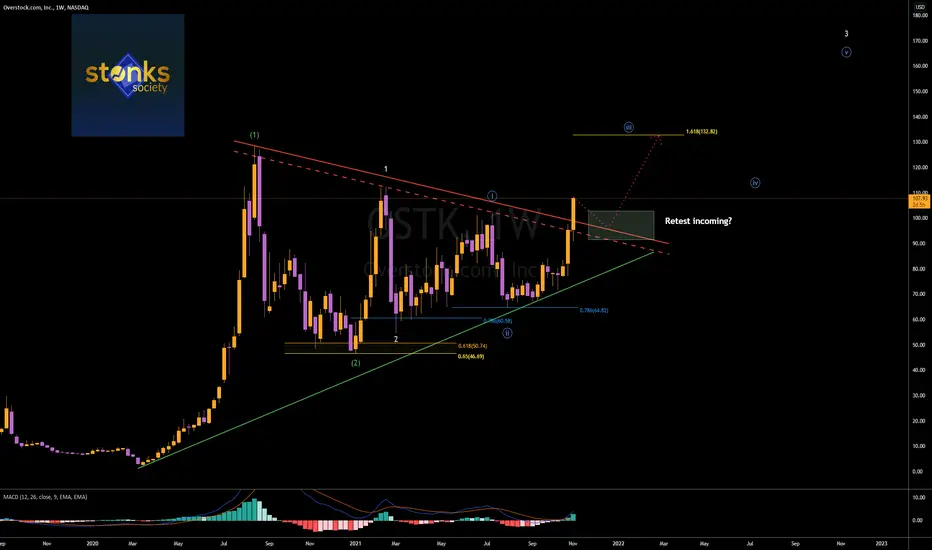
$OSTK | TRADE IDEAIt's probably nothing right...?
Looking for retest and hold of breakout to confirm higher!
OSTK TRIANGLE BREAKOUT Last night, OSTK broke out of a triangle showing very strong bullish momentum.
If you managed to enter when it broke out before it went up higher, then lucky you.
However, for people who did not manage to enter on the breakout, you can always enter when it retest which might come or might not.
If it retest at 95.43 area, i will be interested to enter.
This is just my own analysis. Please do not copy.

Overstock is Ready, Are You?NASDAQ:OSTK
This stock came up on my option scanner and I have to say that I totally agree. This thing could just be getting started.
I looked back to see how price reacted at this level when the above indicator was this far extended. We got some pretty nice gains, most notably the first.
PT $125?

OSTK, pulling back from the resistance lineFrom the history, it can tell the chart price has come to its resistance zone and now is pulling back. It is high risk for those who want to trade it right now. Anyhow, if you wish to invest long term, you can try to wait for some collection around $80 to $77 area.

