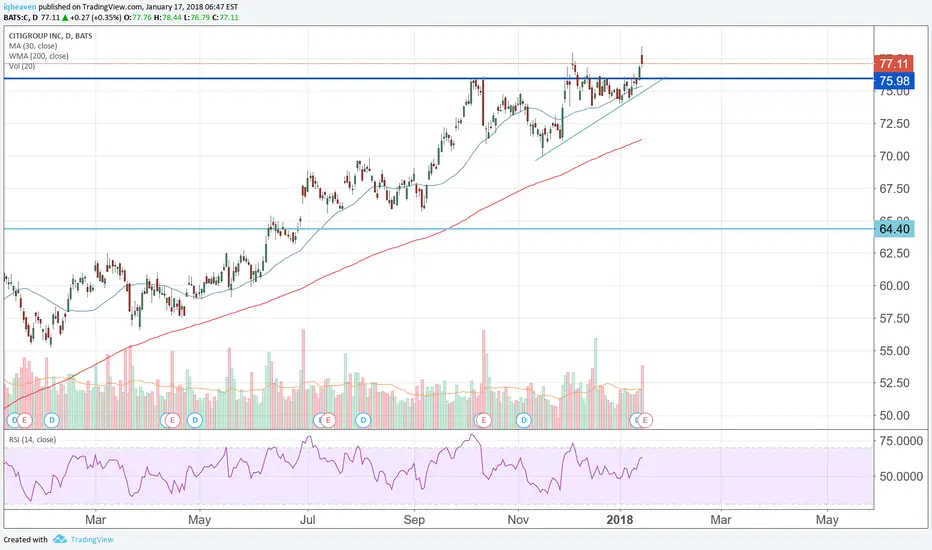
Long on a pull back to supportI'm looking to buy between $74-$75. The 50 day EMA on the daily time frame is about $76. We may bounce, but usually we go a little bit lower.
The 100 day SMA on the daily time frame and the 20 day EMA on the weekly time frame line up nicely around $74.
100 day SMA on Daily:
Weekly chart:
Worst case scenario, C pulls back to the 200 day SMA on daily (~$70), which would be an event better entry.
The trend is your friend ;-)
C trade ideas

C Topping Pattern? Pipe Top?This is a classic topping pattern if C opens lower next week. Warning signal for sure.


C4th Jan. Another financial on my Watchlist. Decent Pullback on Weekly and Daily charts. RSI oversold. Likely more consolidation before starting next wave higher. 75 + Calls.


12.4.17 | C | Day | Andrew AponasJournal Entry: I am tracking along with most of the major financials and banks. I have left the analysis a little light on C compared to some of my other trading idea's however all of these stocks are tightly knit together and heavily correlated so I believe it will be fine the way it is, for now. I am also going to include an Intraday idea for C as well, that way I can take a look at some of the volatility that occurred today and in the past. Ok, the last three trading sessions have been anomalies, yet the market is moving higher. To me this signals the insiders are campaigning to go long and are in control of the market. My first target is at the 0% line of the Fibonacci retracement tool located at a value of $78.67. Price has traded through some key levels, it cleared the Supply Zone, and closed above the .382% line. This to me looks very bullish, and without even looking at any indicators I think the bullish framework is strong. If I had to speculate why today closed as a long legged doji, I would say that the insiders were shaking out the sellers and the market is about to squeeze whatever is left of them again. More will be determined intraday. Thank You, God Bless.
Indicators:
OBV is extremely bullish and plotting above the mean. This is strong indication of bullish framework/an uptrend.
RSI looks strongly bullish and just entering into overbought where it may remain overextended for quite some time. Historically the RSI can remain above overbought pulling back and continuing to rally for the majority of an uptrend.
MACD has just made a major pivot just below the 0 line and is still in great uniformity for an uptrend with the lines still both strongly bullish and spaced well apart.

12.5.17 | C | 30min | Andrew AponasJournal Entry: I made a quick idea for the intraday time frame on C. It looks like price began trading in an upward moving channel after breaking through the price ceiling which has now become a price floor. The volume is declining and the anomaly that occurred I think was an indication of stopping volume; the insiders are keeping the market propped up at this level. Price pivoted off the old ceiling and confirmed it to be a new price floor this is where I am estimating a potential triangle consolidation pattern may be forming. Although this chart pattern is early and speculation it may indicate a bullish breakout back to the range/resistance of the upward moving channel. Thank You, God Bless.

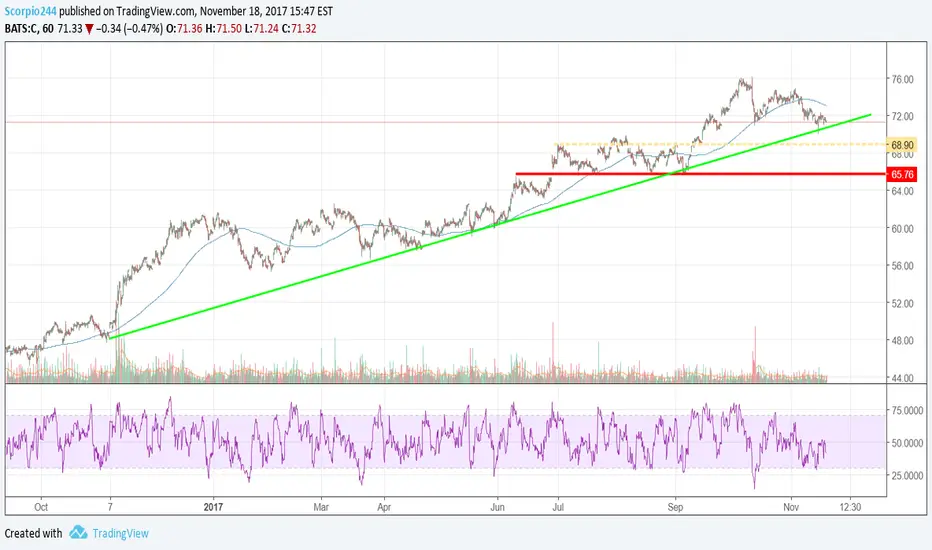
$C short trading plan 11/20/17Channel Down identified at 17-Nov-14:30. This pattern is still in the process of forming. Possible bearish price movement towards the support 70.0200 within the next 2 days.
Supported by Downward sloping and crossing of Moving Average


C bullish bat pattern,demand zone, and fig support combinationC just broke the B point, which makes this harmonic pattern more referable.
There are still some rooms to hit the entry area, while it's a worth trading long opportunity if it can be pulled-back there.
67 is not really a very important fig support, while I believe there will still be some institutional buy limit orders there.
I would like to do 2 entries of this trade, and the second one needs a intra-day reversal sign to do the confirmation entry.


HOMEWORK: EMA200 AS TREND INDICATOREMA200 (Exponential moving average 200 periods)
The simplest moving average system generates trading signals when price crosses the moving average:
Go long when price crosses to above the moving average from below.
Go short when price crosses to below the moving average from above.
It works very well in trends, as you can see here with a high Risk/Reward ratios but it's plenty of false signals when price it is in sideways.

Similiar pattern on $CNot sure about you but i see a similar pattern forming, we call it a double bottom, once it completes its gonna be nice. Take a look for yourself!! We may find resistance at red trendline, but once its break that resistance, my target on $C is $80. Im currently long. Trade at your own risk.


