CAL - Apparel retailer attempting to breakoutRetailer leader. New 52wk highs. Multiple basing patterns. Ready to make a move.
You don't need to know what's going to happen next to make money ~Mark Douglas
Lose like a pro and keep trading, or lose like a novice and quit ~Mark Ritchie
CAL trade ideas

$CAL is breaking out of a ~15 month long base. Can it go higher?Notes:
* Strong up trend since March 2020
* Good earnings in the recent quarters
* Basing for the past ~15 months
* Broke out around the end of May but pulled back to its 200 day line
* Currently breaking out of historical resistance of $29.85 with higher than average volume
* Next historical resistance comes in around $31.38
Technicals:
Sector: Consumer Cyclical - Footwear & Accessories
Relative Strength vs. Sector: 1.8
Relative Strength vs. SP500: 5.0
U/D Ratio: 1.44
Base Depth: 67.62%
Distance from breakout buy point: 1.31%
Volume 11.71% above its 15 day avg .
Trade Idea:
* You can enter now as the price is just breaking out of its base and historical resistance with higher than average volume
* If you're looking for a better entry you can look for one around the $29.85 area as that should hold as support moving forward
* This stock usually has local tops when the price closes around 21.29% above its 50 EMA
* Consider selling into strength if the price closes 21.09% to 21.49% (or higher) above its 50 EMA
* The last closing price is 11.01% away from its 50 EMA

Is $CAL ready to move higher after pulling back?Notes:
* Strong up trend since 2020
* Great earnings in the recent quarters
* Pays out dividends
* Creating a base for the past ~14 months
* Recently bounced from its 200 day
* Pulled back to its 50 day and is now showing signs of recovery with volume
* Historical resistance comes in around 29.85
Technicals:
Sector: Consumer Cyclical - Footwear & Accessories
Relative Strength vs. Sector: 2.83
Relative Strength vs. SP500: 3.88
U/D Ratio: 1.4
Base Depth: 66.55%
Distance from breakout buy point: -6.6%
Volume 27.64% above its 15 day avg.
Trade Idea:
* You can enter now since volume's coming in as it bounces from its 50 day line
* If you're looking for a better entry you can look for one around the 27.3 area as that would be ~50% of the bullish pin bar we got in the last session
* This stock usually has local tops when the price closes around 21.42% above its 50 EMA
* Consider selling into strength if the price closes 21.22% to 21.62% (or higher) above its 50 EMA
* The last closing price is 5.76% away from its 50 EMA

Is $CAL ready to push higher?Notes:
* Strong up trend
* Great earnings
* Breaking out of a ~13 month base with higher than average volume
* Forming a bull flag
Technicals:
Sector: Consumer Cyclical - Footwear & Accessories
Relative Strength vs. Sector: 2.2
Relative Strength vs. SP500: 3.32
U/D Ratio: 1.52
Base Depth: 56.68%
Distance from breakout buy point: 2.22%
Volume 45.81% above its 15 day avg.
Trade Idea:
* You can enter now as the price is just breaking out of the $27.92 resistance area
* Or you can wait for a break above the bull flag
* Or if you want a better entry you can look to enter around the 27.8 area
* This stock usually has local tops when the price closes around 25.12% above its 50 EMA
* Consider selling into strength if the price closes 24.92% to 25.32% (or higher) above its 50 EMA
* The last closing price is 11.57% away from its 50 EMA
* Historical resistance comes around 29.85 and above that around 33.6
* Be on the lookout around 29.85

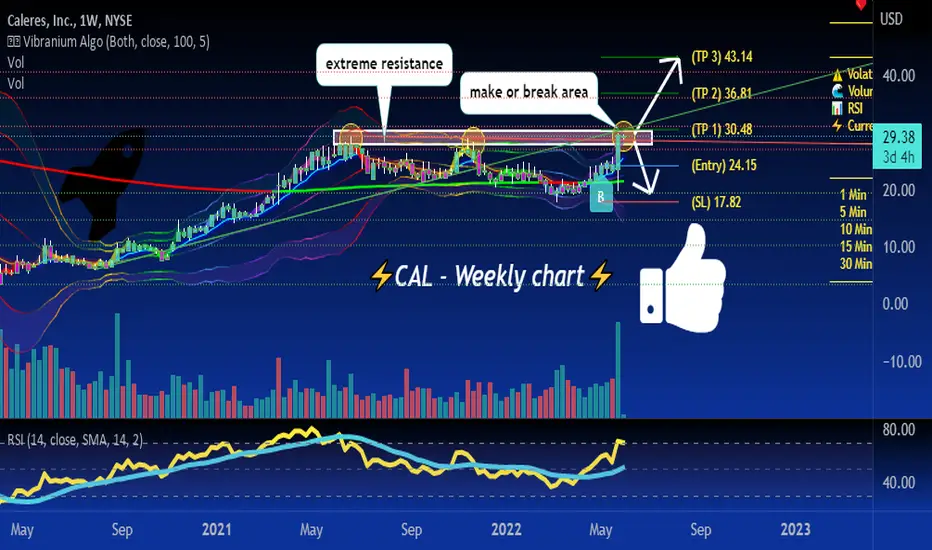
CAL at make or break it area 👀If it can break above some potential targets are 36.81-43.14, but a rejection here can send us back to 18-24 supports. not too clear which way we are headed yet. wait for confirmation


Price action & Psychology - Breakout and first pullbackHello !
I am so excited for the week ahead.
Key points :
Breakout after consolidation + spike in volume
Volume on uptrends is higher than on downtrends
First pullback after breakout (61.8% Fibonacci retracement)
Holding support despite the fact that the overall market was down on friday
Context
The interesting thing on this chart, is that before the consolidation, a double bottom formed. Anyway, the momentum was not important enough to break through the resistance. After consolidating and pulling back halfway (from the second bottom), enough momentum was gathered to breakout, which explains the spike in volume.
This also tells us, that a psychological shift happened : there's been more greed and a stronger conviction (wide range candle and spike in volume).
The plan
Using the top-down method (i.e three screen method), the weekly chart gives us an insight of the bigger picture. The first resistance on the weekly chart is around 14.00. The "minor" resistance at 8.50 is more of a level to watch.
The more candle (i.e confluence) there is around an area, the stronger it is. Anyway, I plan the trade up to that level and I decide what to do once it reaches it.
Thanks for reading and if you have suggestions or wanna discuss the idea, just leave a comment, I'll be happy to answer.
***Disclaimer : This is not an advice to buy the stock. Please, be aware that trading is a matter of probabilities, it takes only ONE trader to deny your trade.***

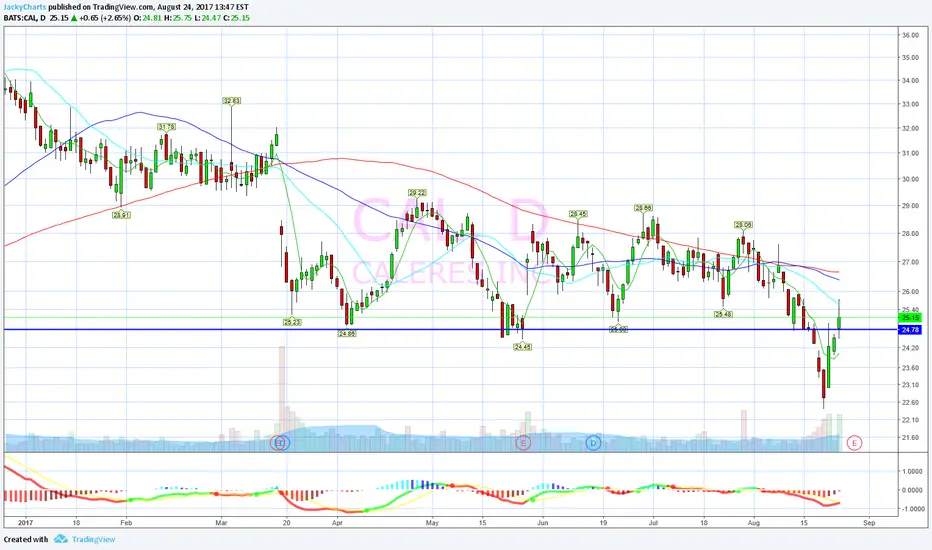
CAL correcting bearish trend with Daily Bullish Breakout Cal has established a bullish daily breakout with a strong candle bar and good volume offering an opportunity for further gains. The stock is in a strong bearish trend in the Weekly and Monthly Charts. However, we may still trade the bullish momentum for a short time.

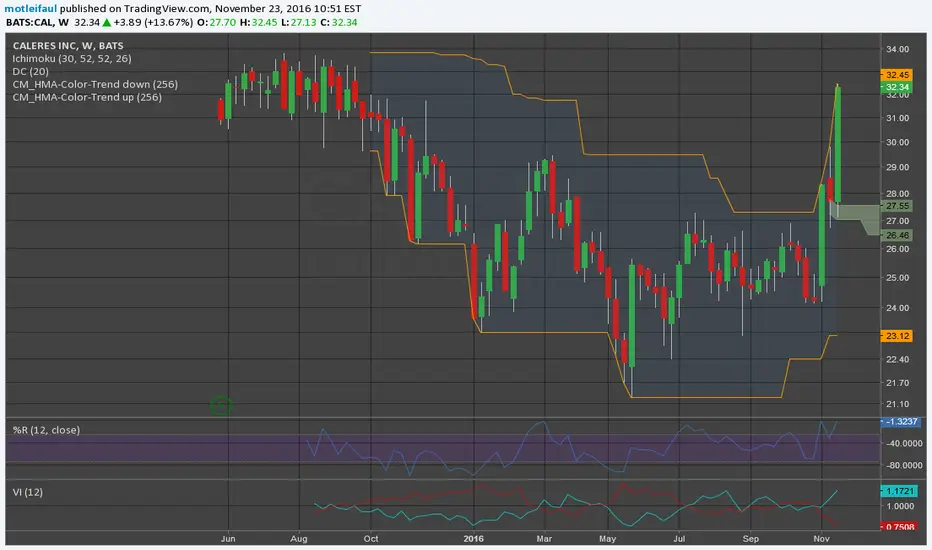
CALShare prices are looking for support at 32.05 currently trading at 32.20 with supporting volume. Support and resistance are marked on the chart

Spring loadedWiseguys built 2k OI in Sept 25 calls on weekly lows. Already doubled from .75 entries.
ready to sell CALguys, the cal is forming a potential bat pattern these days, we see a stagnant on the high level, a reversal pattern may be generated, watch out for the direction chosen move.
good trades guys.