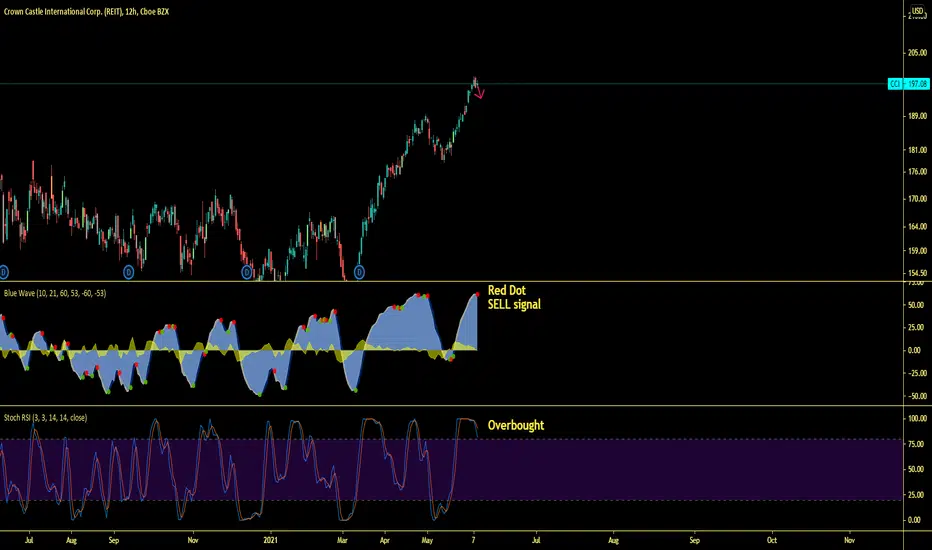
$CCI with a Bullish outlook following its earnings #Stocks The PEAD projected a Bullish outlook for $CCI after a Positive over reaction following its earnings release placing the stock in drift B with an expected accuracy of 100%.
CCI trade ideas

CCI has light at the end of this tunnelBased on historical movement, the trough could occur anywhere in the larger red box. The final targets are in the green boxes. The pending top should occur within the larger green box as has been the historical case. Half of all movement has ended in the smaller green box. In this instance, the signal indicated BUY on February 18, 2022 with a closing price of 162.34.
If this instance is successful, that means the stock should rise to at least 171.32 which is the bottom of the larger green box. Three-quarters of all successful signals have the stock rise 15.282% from the signal closing price. This percentage is the bottom of the smaller green box. Half of all successful signals have the stock rise 18.349% which is the end point of the black dotted arrow. One-quarter of all successful signals have the stock rise 28.872% from the signal closing price which is the top of the smaller green box. The maximum rise on record would see a move to the top of the larger green box. These are the same concepts for the levels in the red boxes as well.
The ends/vertical sides of the boxes are determined in a similar fashion. The peak of the rise can occur as soon as the next trading bar after signal close, while the max rise occurs within the limit of study at 35 trading bars after the signal. A 1% rise must occur over the next 35 trading bars in order to be considered a success. Three-quarters of successful movement occur after at least 14 trading bars; half occur within 27 trading bars, and one-quarter require at least 31 trading bars.
The black dotted arrow represents median historical movement. Medians are a good metric, but they are just one of many I use when forecasting future movement.
As always, the stock could decline the very next bar after the signal without looking back (therefore the red boxes would not come into play) or the stock may never decline (and the green boxes may never come into play).


Crown Castle historically rides much higher; Will it happen now?The full analysis is well worth the read. CCI signaled BUY 2 days ago. The delay in upward movement is between 1-3 days (the median delay is 1 day). We are beginning the third day today which means upward movement should be imminent. Of the 15 times the RSI algorithm has signaled on the daily chart has lead to the stock rising a minimum of 11% over the next 35 trading days. If history holds true, that means the stock could rise to at least 195 which is a significant jump. Of course this may also be the occasion for the stock to move up and the minimum movement be more around the area of just a few percent.
Based on historical movement, the trough could occur anywhere in the larger red box. The final targets are in the green boxes. The pending top should occur within the larger green box as has been the historical case. Half of all movement has ended in the smaller green box. In this instance, the signal indicated BUY on September 28, 2021 with a closing price of 175.06.
If this instance is successful, that means the stock should rise to at least 195.49 which is the bottom of the larger green box. Three-quarters of all successful signals have the stock rise 15.451% from the signal closing price. This percentage is the bottom of the smaller green box. Half of all successful signals have the stock rise 18.955% which is the end point of the black dotted arrow. One-quarter of all successful signals have the stock rise 28.996% from the signal closing price which is the top of the smaller green box. The maximum rise on record would see a move to the top of the larger green box. These are the same concepts for the levels in the red boxes as well.
The ends/vertical sides of the boxes are determined in a similar fashion. The peak of the rise can occur as soon as the next trading bar after signal close, while the max rise occurs within the limit of study at 35 trading bars after the signal. A 1% rise must occur over the next 35 trading bars in order to be considered a success. Three-quarters of successful movement occur after at least 12 trading bars; half occur within 28 trading bars, and one-quarter require at least 32 trading bars.
The black dotted arrow represents median historical movement. Medians are a good metric, but they are just one of many I use when forecasting future movement.
As always, the stock could decline the very next bar after the signal without looking back (therefore the red boxes would not come into play) or the stock may never decline (and the green boxes may never come into play).

Potential Pull Back but Longterm Growth for CCICCI looks attractive due to market segment and potential inflation. If there is no tapering CCI can still grow. Target price 275 next 18 month.

Pull Back FishingAppears to be trading in a butterfly, which is a harmonic pattern.
XA is the impulse leg, and D would be at 1.27 extension of the XA leg. If indeed this is a butterfly, it is considered a reversal pattern. So there has to be a trend one way or the other to reverse. There is also a bearish butterfly that looks like a crooked W.
Not a recommendation
There is often volatility at the landing pad.

Weekly bull flagThis closed really strong and weekly bull flag. On watch for breakout, if market cooperates this can make a new ATH

Ramp up with the rest of the 5G playsIt looks like CCI is beginning to turn. It's been pulled down with the rest of the REITs due to interest rate action but this is not as much of a headwind as people think.
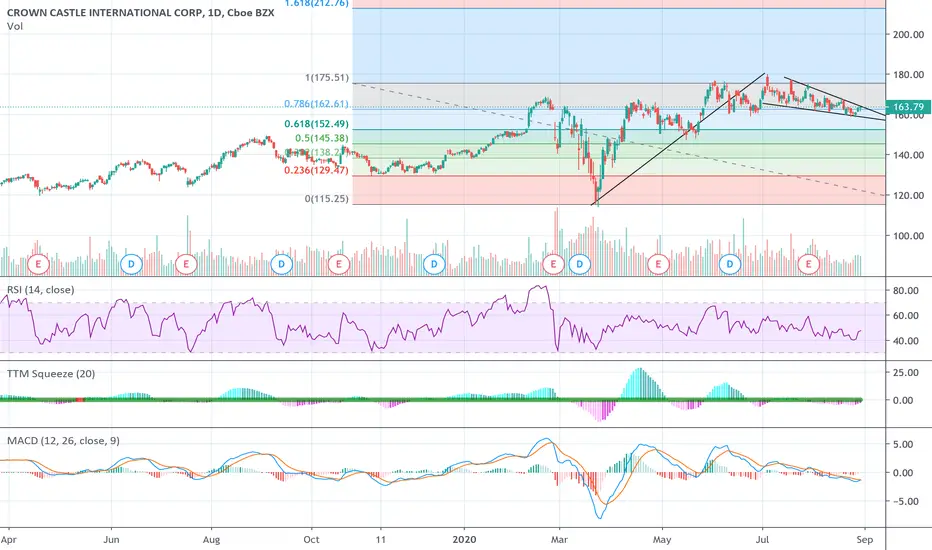
The chart looks very similar to the end of 2019. The price action seems similar as well. The stock keeps bouncing off the fibs pretty decisively. I think you see a continued move up through 170 and a breakout to new highs.
A breakdown below the 148 fib level likely means a fall to support at 135-140.


Crown Castle CCI. w48 2020. Open 147Monthly
uptrend
From 2009
Weekly
Uptrend with divergency by RSI
D aily
I will open only from 140
SL 129
TP 170
RR 2.2

CCI Bullish SwingTradingview is rating CCI a "strong buy". What I see is great bullish momentum which led to a close at the high of the week. It has ripped all throughout the week. CCI has been reliably bullish for many months now, showing a strong uptrend. Technical indicators are showing great momentum upwards.

CCI-0.209*EQIX Crown Castle Int $CCI vs. Equinix Inc $EQIXQuantamental Tools for Proprietary and Retail Investors.
Statistical Arbitrage Opportunities Delivered to Your Inbox.
QuantChart. io
Short 1000 $CCI
Long 209 $EQIX
Mean Reversion Time: 8 Trading Days

$CCI posting a disappointing earnings$CCI posted less than expected earning but still the PEAD is projecting a neutral outlook for the price, With price currently trading around the median line.

CCI-0.53*SBAC $CCI (Crown Castle Int Corp) vs. $SBAC(SBA Commun)Quantamental Tools for Proprietary and Retail Investors.
Statistical Arbitrage Opportunities Delivered to Your Inbox.
QuantChart. io
Short 100 $CCI
Long 53 $SBAC
Mean Reversion Time: 8 Trading Days

Crown Castle, as both a REIT and 5G play looks ready to moveCrown Castle is first a REIT and then a 5G play. The industry is ramping up infrastructure and will do well in the years following as the tower provider leases more and more capacity to the new 5G rollout. Given the surge in Work From Home (WFH) as well as continued advances in technology, 5G will be the mainstay in just a couple of short years. This will empower the engine of revenue growth for this company as well as the earnings and dividends. I'm looking for a consistent move upward over the next 5-7 years from this.
#CCI #5G #REIT
NYSE:CCI

CCI LongI am very bullish on this stock due to it being a major 5G stock. There is a resistance level at $175 and if the stock can breakout of this level then it can reach a target price of $220
Since the March lows it has increased back to pre Covid levels ( common to most tech stocks ) and is currently in a consolidation period in a bullish wedge. If it breaks out of the wedge bullish then i expect to see it reach $220 later this year.
Update CCi (Re-Buy), Target is GoingCCi has a good "Cup and Handle" model but has been continuously delayed due to bad market, now it is back and continues to search for target $220
CCi buy when : $167
Target : $220
Stop loss : $155
Wish you good deals!

Ascending TriangleEarnings in October/ I plan to go Long after resistance of upper trendline is broken with confidence/has broken once/After upper trend line is broken, this will become possible support. I am Neutral until breaks out of pattern..unless it breaks down and I catch it on the pull back (o:
CCI has pierced upper trendline once and hit 180ish
Monthly and weekly candles are both red shooting stars. I plan to proceed with caution. 5g is hot so things can change in a heartbeat! She may break out at anytime I suppose
Triangle sits at 147.5 and 155 on the up sloping bottom trend line. Upper trendline is at 176.86 (Resistance that must be broken)
Price must break the resistance line of the A Triangle with confidence Strong support noted at 161 to 164ish
Ascending Triangle often means a move up. But on occasion, a move down. There is such a thing as a Busted Ascending Triangle. A break up is more likely when price is above the 200 ma. CCI is abover the 200 daily ma
Bulkowski has a lot of free education available online. During his studies, he states 63% of the time, an ascending triangle will break up
It is a period of accumulation and is a continuation pattern so an uptrend needs to proceed it. I should be all over this but am gonna watch it.
Stock dipped out of most recent rising wedge on Friday/Pierced bottom trend line of rising wedge
Trade safely

Crown Castle is expensive P/E 96.41 (very high)
Forward P/E 59.56
Dividend 2.88
Current Ratio 0.5
Debt/Eq 1.85
EPS this Y +45.7%
Gross Margin +66%
Profit Margin +12.9%

$CCI Crown Castle 5G trade
Yet another 5G company ready to make a major move and earnings
may be the catalyst.
Indicators are in bullish reversal
Moving averages strong support.
Volume increasing
PLEASE GIVE US A LIKE IF YOU FIND OUR CONTENT HELPFUL, THANK YOU.

CCI - Triple Top - SHORT Break of trendline. Will be looking for a 15 cent entry below the open on Friday ($166.26). Short term hold due to earnings. Super nice target if it gives way. WILL AVOID if it gaps down too much on Monday's open.
