Bias more on upside for CHPT28th Jan 2023
CHPT may ride with the current bullish trend in the EV sector.
Resistance: 15/19
Support: 9
CHPT trade ideas

CHPT Bullish BiasCHPT has now bounced back from a very strong Fib channel of 0.5
The next level is also broken and looks a momentum is building up to continue to make double top
This gives us an opportunity to ride the Bull trend
Entry : 11.10
SL : 10.49
TP1 : 11.71
TP2 : 12.27
Bearish Indications is a chart pattern called rising wedge
If the price falls below 10.50 then it can be short sell to make some gains

2023 New Year Long Opportunity - $CHPTI'm looking for a long opportunity on NYSE:CHPT in 2023.
Before 2022, it's all-time low was $9.38, and it tested and closed above this level twice. Once in the second and again in the fourth quarter of 22'.
In the most recent quarter, Chargepoint also tested and closed above the trend line from that all-time-low of Q1 2020 and Q2 2021 (dashed line)
This leaves me to believe, $CHPT will be a good long term opportunity for this year.

CHPT | Things Are Charging Up | LONGChargePoint Holdings, Inc. provides electric vehicle (EV) charging networks and charging solutions in the United States and internationally. It offers a portfolio of hardware, software, and services for commercial, fleet, and residential customers. The company was founded in 2007 and is headquartered in Campbell, California.

Long entry breakoutBased on the stock individually I see a big upside potential, this should be done in conjunction with the overall market sentiment (SPY, etc... ) and fundamentals.

Canada announced partnership with Charge Point. Charge Point wanCanada announced partnership with Charge Point. Charge Point want to deliver Europe and North America with charge points for EV. This is already being done, and more importantly the numbers they had shown the partners were that the suspected total investments would grow to 60 BILLION dollars in 2030 and 192 BILLION in 2040. Imagine several country's teaming up with Charge Point, country's who have tight relations with the WEF.
Please understand that this is a long term investment one to ten years max, could be less?

CHPT - Bearflag ?
Got sold hard into the supply and trying to base below 200DMA. Good ER didn't do much good, but 14 is the volume shelf, if it can build there, It has better chance of breakout to the upside soon.
below 14, will continue to fade to 11 and 8.5
CHPT ChargePoint Holdings Options Ahead Of EarningsLooking at the CHPT ChargePoint Holdings options chain, i would buy the $17 strike price Calls with
2022-9-2 expiration date for about
$0.33 premium.
Looking forward to read your opinion about it.


Defined Risk Strategy on CHPTThe Biden administration approved the first $900 million (of $5 billion) in spending for EV charging infrastructure, sending stocks like QS, BLNK, FSR and CHPT soaring with the announcement and then neutralizing today. The 50 and 100 EMA's crossed, which some might say is a buy signal, but the RSI tops are sloping slightly down -- uncertain if it will trend down briefly.
Here's how I'm defining my risk, sacrificing a bit of upside for downside protection. This makes up to 22% (35% annualized) while also cushioning ChargePoint from a fall of up to 46% (to below $9.81, through 5/19 next year) before my investment breaks even.
Hedged options:
Buy 1 $18 call
Sell 1 $22 call
Sell 2 $10 puts
Exp 5/19/23
Capital Required: $1994.64

Blackout coming on CPHTTrade thesis is pretty straightforward on this one:
✅Rising wedge
✅Bearish divergence on the daily chart
✅Lower risk area for a short here with a defined stop
✅Macro bearish environment


CHPT: Intraday Bullish EngulfingCHPT: Intraday Bullish Engulfing identified on 65m chart. Clean breakout post Credit Suisse coverage initiation in the premarket session. KL's to watch are 15.60, 15.87, 16.00; Breach and > 16.00 is on watch for a gap fill. Downside KLs 14.87, 14.61, 14.00: Breach and <14.00 is on watch for a gap fill// Bias: Neutral to Bullish short term, Beta: 1.96 ATR: 4.21, IV: 83.22%

I’ve been short selling every popThe trends your friend and current monetary policy makes everything bearish
This trend is pretty defined. I wait for resistance on a one minute chart before entering.
Under the 1 day 200 Ema

CHPT big upsideCHPT broke a trendline in July of this year that started in January 2021, after a large push up the stock has regressed back to the trendline and bounced off nicely. With earnings for CHPT only 8 days away, depending on the results I believe this could be the start of a huge rise in the stock.
AGAIN, be weary of buying anything before or after earnings. However, based on positive recent publicity and the stock trend, things are looking very good for CHPT. If you have the risk appetite I would be a buyer and long-term holder

ChargePoint posting higher lows? ChargePoint Holdings
Short Term
We look to Buy at 15.89 (stop at 14.18)
Preferred trade is to buy on dips. Previous resistance at 16.00 now becomes support. We have a 38.2% Fibonacci pullback level of 15.15 from 8.50 to 19.27. The sequence for trading is higher highs and lows.
Our profit targets will be 20.95 and 21.71
Resistance: 19.20 / 20.99 / 26.73
Support: 16.00 / 12.00 / 8.50
Disclaimer – Saxo Bank Group. Please be reminded – you alone are responsible for your trading – both gains and losses. There is a very high degree of risk involved in trading. The technical analysis, like any and all indicators, strategies, columns, articles and other features accessible on/though this site (including those from Signal Centre) are for informational purposes only and should not be construed as investment advice by you. Such technical analysis are believed to be obtained from sources believed to be reliable, but not warrant their respective completeness or accuracy, or warrant any results from the use of the information. Your use of the technical analysis, as would also your use of any and all mentioned indicators, strategies, columns, articles and all other features, is entirely at your own risk and it is your sole responsibility to evaluate the accuracy, completeness and usefulness (including suitability) of the information. You should assess the risk of any trade with your financial adviser and make your own independent decision(s) regarding any tradable products which may be the subject matter of the technical analysis or any of the said indicators, strategies, columns, articles and all other features.
Please also be reminded that if despite the above, any of the said technical analysis (or any of the said indicators, strategies, columns, articles and other features accessible on/through this site) is found to be advisory or a recommendation; and not merely informational in nature, the same is in any event provided with the intention of being for general circulation and availability only. As such it is not intended to and does not form part of any offer or recommendation directed at you specifically, or have any regard to the investment objectives, financial situation or needs of yourself or any other specific person. Before committing to a trade or investment therefore, please seek advice from a financial or other professional adviser regarding the suitability of the product for you and (where available) read the relevant product offer/description documents, including the risk disclosures. If you do not wish to seek such financial advice, please still exercise your mind and consider carefully whether the product is suitable for you because you alone remain responsible for your trading – both gains and losses.


Charge Up After the Break Point on ChargePoint Holdings Inc.!Charge Up After the Break Point on ChargePoint Holdings Inc.!
I strongly believe ChargePoint Holdings Inc. is "charging up" after the break of the upper trendline!
If we hold above the break through the bottom of the week, I will enter a swing trade on CHPT.
The following patterns were identified prior to the break of the upper trendline-"Double Bottom" inside "Falling Wedge"
*This is not financial advice.
Loved and Blessed,
MrALtrades00

Crypto sphereYes Eth is making some moves. Ethereum chart has the best setup! compared to every other chart.

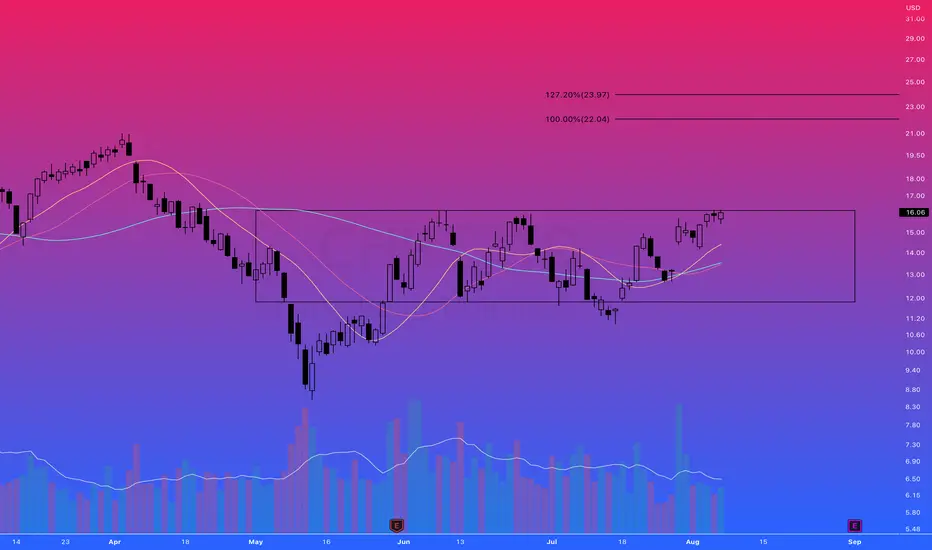
$CHPT Looking to Breakout?$CHPT Looks like ChargePoint is getting ready to breakout of a consolidation area. See notations on chart. It is currently right at resistance area. I added a ¼ position today in anticipation of a breakout. I like that it is above the 8 and 21 EMA as well as the 50 DMA and 2 AVWAPS. However, it is still below the 200 DMA and the IPO AVWAP. You can see we have a higher low in. I will be looking to build out the position if / when it breakout out of this area with volume. You may want to put this one on your watchlist. Ideas, not investing / trading advice.


time to add chpttime to add chpt..daily resistance line broken..now looks bullish target 20 and above