Chipotle Mex Grill CMG Daily - Rally to 50% and EPS resistanceCMG - ready for another go at CMG on the short side - The last stop was very close at only 1 ATR and it got hit right away. Oddly enough, that at least shows some strength in CMG for future reference. If CMG was very weak, it would have stopped at the key resistance level that I highlighted. The fact that it could get back up to the mid-point of the decline is a good sign for it longer term.
CMG also tagged the earnings line that I have drawn here. That is a key resistance level and a low-risk level to sell short against. I missed pointing it out as a trading level for us here.
The ATR(11) is 10.8 points, which means CMG is twice as volatile as the stock market. I see 555 now as a stop level and my target will be 510 instead of 500 on this 2nd effort.
542.65 last, -2.77
May 31, 2014 12:42PM EST
Tim
CMG trade ideas

Chipotle Mexican Grill - CMG - Daily - Low risk short sale hereCMG is rallying towards the half-way-back level of 548 from its recent high volume decline. The rally is on lower volume, which implies a weaker rally. The "EARNINGS SUPPORT and RESISTANCE" is also playing into this trade and the rally will very likely be halted at the 548 level from remaining sellers from the last earnings report.
Keep in mind that CMG is rich in valuation, trading at 5.2 times sales. That is a crazy level of valuation for a restaurant stock. Sales have more than doubled in the last 4 years, which is a growth rate of 18%. After-tax margins are hovering near 10%. However you look at it, CMG is priced for massive growth and profits. The free cash flow is $300 million, which is less than 2% of its market value today. If you bought CMG today, that would be your return: 2%. Granted, that number is growing but so are the competitors. QDoba's are opening all over my area, for example. It will take another 4 years for this stock to grow into it's current valuation, in my opinion.
Suggestion: Sell short: 548 stop. 502 target. Risk 1 ATR. Reward 3 ATR's.
11:36AM EST, May 28, 2014 536.96 last +0.92

CMG m/a crossover worked.I seems that there are traders programming in moving average crossover signals.


Chipotle : Heading to Fill the GapA unique bearish three crows candles pattern before breaking the double top formation. I look for further downside, downside target at 443.00 support


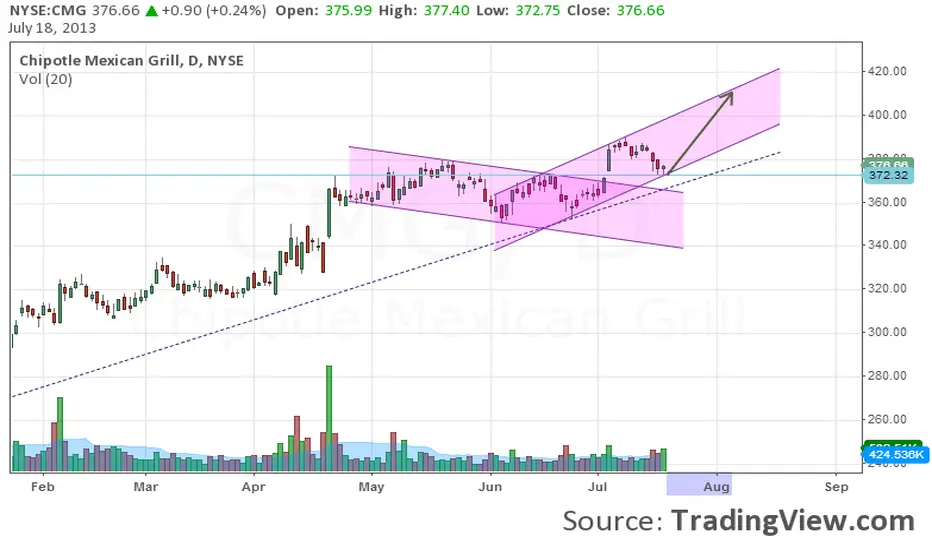
Chipotle Mexican Grill, Inc. (CMG) Epic Trend Line To WatchChipotle Mexican Grill, Inc. (NYSE:CMG) has recently run into an epic trend line that signals a longer term top in the stock. This trend line stretches back to 2007, 2012 and now 2013. Each time this level has been reached, the stock has pull back significantly. A pull back over the next 6 months could yield an easy target of $450.00.
Gareth Soloway
Chief Market Strategist
www.InTheMoneyStocks.com


Short idea for $CMGBearish Harmonic Pattern/Fibbonaci lined up with a Major Resistance Zone.
Looking for 1 more push before getting short.
Stochastic indicator is showing the stock is major over bought zone.
MACD is looking ready for a bearish cross over.
Aiming to get short between 420-430.
A small bearish MACD divergence is forming.


2-hour candle trendline &S/R $STUDYPrice found support dead on my line. Could bounce tomorrow but below 372 es no bueno, Signor.


Bullish upgrade to $430 from Argus Boom goes the dynamite! Channel / TL Res at 385 above is 397 gap fill. Valuations stretched.
