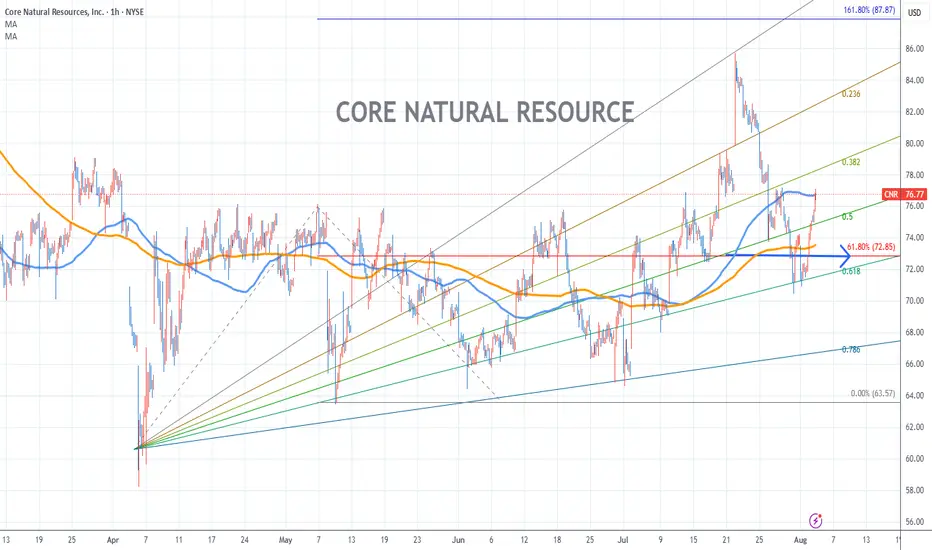
Core Natual Resource Chart Fibonacci Analysis 080425Trading Idea
1) Find a FIBO slingshot
2) Check FIBO 61.80% level
3) Entry Point 73/61.80%
Chart time frame:B
A) 15 min(1W-3M)
B) 1 hr(3M-6M)
C) 4 hr(6M-1year)
D) 1 day(1-3years)
Stock progress:A
A) Keep rising over 61.80% resistance
B) 61.80% resistance
C) 61.80% support
D) Hit the bottom
E) Hit the top
Stocks rise as they rise from support and fall from resistance. Our goal is to find a low support point and enter. It can be referred to as buying at the pullback point. The pullback point can be found with a Fibonacci extension of 61.80%. This is a step to find entry level. 1) Find a triangle (Fibonacci Speed Fan Line) that connects the high (resistance) and low (support) points of the stock in progress, where it is continuously expressed as a Slingshot, 2) and create a Fibonacci extension level for the first rising wave from the start point of slingshot pattern.
When the current price goes over 61.80% level , that can be a good entry point, especially if the SMA 100 and 200 curves are gathered together at 61.80%, it is a very good entry point.
As a great help, tradingview provides these Fibonacci speed fan lines and extension levels with ease. So if you use the Fibonacci fan line, the extension level, and the SMA 100/200 curve well, you can find an entry point for the stock market. At least you have to enter at this low point to avoid trading failure, and if you are skilled at entering this low point, with fibonacci6180 technique, your reading skill to chart will be greatly improved.
If you want to do day trading, please set the time frame to 5 minutes or 15 minutes, and you will see many of the low point of rising stocks.
If want to prefer long term range trading, you can set the time frame to 1 hr or 1 day.
CNR trade ideas
Swing Long for Core Natural ResourcesCoal manufacturing will likely thrive under the Trump administration. Looking to surge upwards from this major support zone.

CNR - Cup and Handle formation - LONGYou can see a cup and handle formation that is nearing its' end in the chart for CNR - this is therefore a bullish call.
As well as that, CNR operates in the real estate materials space and with real estate expecting to see a supercycle in the states in the next decade, this is a conducive trade within that context.


Cornerstone Building BrandsStrategy/Chart pattern: Bull flag
Entry: Immediately (Limit 19.50$)
Stop: 17.40$
Target: 23.60$
Risk/Reward-Ratio: > 3:1
Stopmanagement: ATR stops daily chart default settings

VCP Pattern WatchA lot of the tickers I'm watching have earnings soon. Guess it's just that season.
Volume has been declining. Looking for some volume to come in.
RS isn't great but towards a 2 week high.

Cornerstone Building BrandsChart pattern: Bull flag
Entry: 14.50$ (this would end the secondary downtrend of the correction)
Stop: 13.32$
Target: 16.90$
Stopmanagement: ATR Stops hourly chart default settings
Risk:Reward-Ratio: > 2:1
Description: The chart is forming a bull flag with a nice corrective pattern (which retraced under the 38 Fibonacci retracement ). Target is the 1:1 Fibonacci extension of the former impuslive move.
Ordersize example: If you have a 10000K to trade and you only want to risk 1% of your volume, you can enter this trade with 1250$.


CNR: Ascending Triangle, ConfirmedAscending triangle, Confirmed
Pros
Descending volume + increase on break out
PPS above 50MA and 200MA
250RSI above 50
Cons
200MA FLAT
Descending ATR
PT1 = 9,18 (Filled)
PT2 = 10,42
PT3 = 11,42
Bonus PT4 = 12,05
Bonus PT5 = 13,10

Head and Shoulders InverseBeautifully formed Inverse Complex H&S; PT: $8.6/ 28% > current SP. Pattern void until Confirmed B/O.

CNR - bottom reversal, long for 20-40% by Christmas.Cornerstone Building Brands, Inc. manufactures and markets metal products for the nonresidential construction industry in North America.
I'd say this is a great play right now, but you have to buy at around 6.40-6.50, with first targets at 7.60 (that mini gap), then up again at 8.75. You can hold some to see if it goes further, but it's in IYR, which is due for a short term correction. This can still pop, but it just means it will lose steam as the big players will drag the rest of the market down. Note that short term, Chinese metal is expensive, which means American metal will become the alternative.
I've got my alerts set for 6.40.

CNR: It took the Rule of 4 to break the trendlineHopefully the rule of 4 should work again for CNR to stay above the trendline.

$CNR is one of the cheapest stocks I have found in a while
By far one of the cheapest stock I have fond in a long time. Please note on a weekly scale, my proprietary positive volume index is off the charts. Insiders have been buying like crazy
