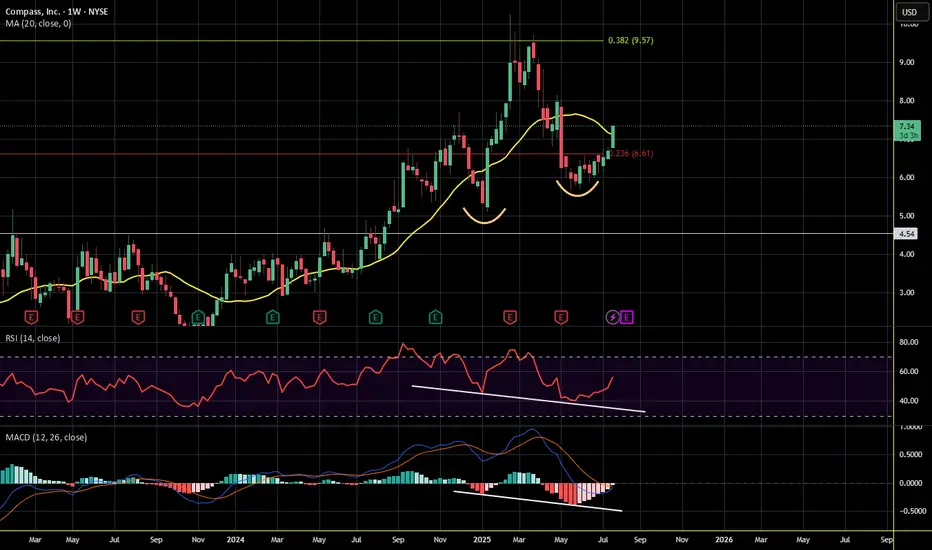
Bullish Hidden Divergence - COMP WeeklyDecent looking divergence on the weekly timeframe -- HIdden divergence on both MACD and RSI with higher lows in price
COMP trade ideas
Hello BullishHello Again, entered long for Compass Inc. with shown entry, SL and TP1 and TP2 points.
I see daily candle confirmation. along with expected incoming interest rate variation, I expect booming. Let's us. Compare my analysis to yours and take it on your own responsibility.
As usual, this is not a financial advice.
Give me your thoughts!

COMP/USD – 30-Min Breakout Trade Setup!📌
🔹 Asset: Compass, Inc. (COMP/USD)
🔹 Timeframe: 30-Min Chart
🔹 Setup Type: Symmetrical Triangle Breakout
📌 Trade Plan (Long Position)
✅ Entry Zone: Above $9.10 (Breakout Confirmation)
✅ Stop-Loss (SL): Below $8.60 (Break of Support & Triangle)
🎯 Take Profit Targets
📌 TP1: $9.61 (First Resistance Level)
📌 TP2: $10.28 (Final Target – Extended Move)
📊 Risk-Reward Ratio Calculation
📈 Risk (SL Distance): $9.10 - $8.60 = $0.50 risk per share
📈 Reward to TP1: $9.61 - $9.10 = $0.51 (1:1.02 R/R)
📈 Reward to TP2: $10.28 - $9.10 = $1.18 (1:2.36 R/R)
🔍 Technical Analysis & Strategy
📌 Symmetrical Triangle Breakout: COMP is forming a consolidation pattern with a breakout above $9.10 signaling bullish momentum.
📌 Trendline & Support Bounce: Price is testing key trendline resistance, with a breakout likely to push it toward higher resistance levels.
📌 Breakout Confirmation: A strong bullish candle closing above $9.10 with increasing volume confirms the trade.
📌 Momentum Shift Expected: Holding above $9.10 could trigger a rally toward TP1 ($9.61) and TP2 ($10.28).
📊 Key Support & Resistance Levels
🟢 $8.60 – Strong Support / Stop-Loss Level
🟡 $9.10 – Entry / Breakout Level
🔴 $9.61 – First Resistance / TP1
🟢 $10.28 – Final Target / TP2
🚀 Trade Execution & Risk Management
📊 Volume Confirmation: Ensure strong buying volume above $9.10 before entering.
📈 Trailing Stop Strategy: Move SL to entry ($9.10) after TP1 ($9.61) is hit.
💰 Partial Profit Booking Strategy:
✔ Take 50% profits at $9.61, let the rest run to $10.28.
✔ Adjust Stop-Loss to Break-even ($9.10) after TP1 is reached.
⚠️ Fake Breakout Risk
❌ If price fails to hold above $9.10 and falls back, it could indicate a false breakout—exit early.
❌ Wait for a strong candle close above $9.10 for confirmation before entering aggressively.
🚀 Final Thoughts
✔ Bullish Setup – Holding above $9.10 could lead to higher targets.
✔ Momentum Shift Possible – Watch for volume confirmation.
✔ Favorable Risk-Reward Ratio – 1:1.02 to TP1, 1:2.36 to TP2.
💡 Stick to the plan, manage risk, and trade smart! 🚀🏆
🔗 #StockTrading #COMP #BreakoutTrade #TechnicalAnalysis #MomentumStocks #ProfittoPath #TradingView #StockMarket #SwingTrading #RiskManagement #ChartAnalysis 🚀📈

COMP/USD – 30-Min Long Trade Setup!📊 🚀
🔹 Asset: COMP/USD
🔹 Timeframe: 30-Min Chart
🔹 Setup Type: Bullish Wedge Breakout
🚀 Trade Plan (Long Position):
✅ Entry Zone: Above 10.23 USD (Breakout Confirmation)
✅ Stop-Loss (SL): Below 9.60 USD (Breakout Invalidated)
🎯 Take Profit Targets:
📌 TP1: 11.08 USD (First Resistance Level)
📌 TP2: 12.06 USD (Extended Bullish Target)
📊 Risk-Reward Ratio Calculation:
📈 Risk (SL Distance): Below 9.60 USD
📈 Reward to TP1: 11.08 USD
📈 Reward to TP2: 12.06 USD
🔍 Technical Analysis & Strategy:
📌 Breakout Confirmation: A strong push above 10.23 USD signals bullish momentum.
📌 Pattern Formation: Bullish Wedge Breakout, indicating a potential upside continuation.
📊 Key Support & Resistance Levels:
🟢 9.60 USD – Strong Support / Stop-Loss Level
🟡 10.23 USD – Breakout Zone / Entry Level
🔴 11.08 USD – First Profit Target / Resistance
🟢 12.06 USD – Final Target for Momentum Extension
🚀 Momentum Shift Expected:
📌 If price stays above 10.23 USD, it could rally towards 11.08 USD and 12.06 USD.
📌 A high-volume breakout would strengthen the trend continuation.
🔥 Trade Execution & Risk Management:
📊 Volume Confirmation: Ensure strong buying volume above 10.23 USD before entering.
📈 Trailing Stop Strategy: Move SL to entry (10.23 USD) after TP1 (11.08 USD) is hit.
💰 Partial Profit Booking Strategy:
✔ Take 50% profits at 11.08 USD, let the rest run to 12.06 USD.
✔ Adjust Stop-Loss to Break-even (10.23 USD) after TP1 is reached.
⚠️ Fake Breakout Risk:
If price falls below 10.23 USD, wait for a retest before considering re-entry.
🚀 Final Thoughts:
✔ Bullish Setup – Holding above 10.23 USD could lead to higher targets.
✔ Momentum Shift Possible – Watch for volume confirmation.
✔ Favorable Risk-Reward Ratio – 1:1.13 to TP1, 1:2.46 to TP2.
💡 Stick to the plan, manage risk, and trade smart! 🚀🏆
🔗 #StockTrading #COMPUSD #BreakoutTrade #TechnicalAnalysis #MarketTrends #ProfittoPath #DayTrading #MomentumStocks #SwingTrading #TradingView #LongTrade #TradeSmart #RiskManagement #StockBreakout #Investing #StockAlerts #ChartAnalysis 🚀📈

Symmetrical triangle on $COMP. Low Volatility ahead of earningsTechnical Setup: NYSE:COMP has shown lower highs and higher lows, forming a classic symmetrical triangle, suggesting potential for either a continuation of the current trend or a reversal.
Key Levels to Watch: Watch for a breakout above the upper trendline for a potential bullish move or a breakdown below the lower trendline for a bearish scenario.
Volatility Note: Low volatility is typical in symmetrical triangles; expect an increase in volume and price movement around earnings. Earnings reports are coming up on Wednesday, October 30th.

COMPASS Buy Set UpPrice bottomed out around 1.85 and reversed for a Daily uptrend. I have a Daily BOS so Im waiting for a Bearish candle to be bigger than the previous Bullish candle to begin the retest, then a continuation up towards 5.17 area

$compCan compass finally make a move after IPO? Was beat down during covid highs, beat down on interest rates, stock is down 90% since its public offering. Looks like it made a 100% move recently after hitting its 1.84 low... Stock looks like it is neutralizing- not sure how much longer the shorts can grab off a 90% sell off- looks like there is some opportunity opening up for bulls.

COMP long
Price is down 85% from the top at $22
They have been dumping equity stakes onto their own agents for 2 years as a voluntary alternative to paying out commission. Many people have been burned leading to a class action suit (several over their history)
They have 3 quarters of cash left
They are doing mass layoffs of 450 employees
I'm not giving away my price targets this time.
Get good.


$COMP: Double Bottom with Bullish Divergence Channel BreakoutCOMP is Double Bottoming after showing 3 Instances of Bullish Divergence on the RSI and is now trading above an Assumed Channel which if it hold could signal a Break Hook and Go that could take it up to as high as a 1.618 Fibonacci Extension.

COMP Trade zones Taking a look at this stock because of a screener alert.
Here's a chart with zones marked. It looks like in the really long term you might see upwards of $13, but I wouldn't expect it to be higher than $18.
I think currently, $9 seems to be where this stock is heading.
A Monday morning dip could definitely be a buy opportunity to $9.
I also, am noticing a lot of trends in the market leading to march 17th through the 23rd which are showing a possible big movement (crash maybe). I'll keep watching, but just be careful around those dates.

COMP buys loading targeting $20+Lets see if this wave pattern stays in tact and holds its validity, targeting well over $20 a share
