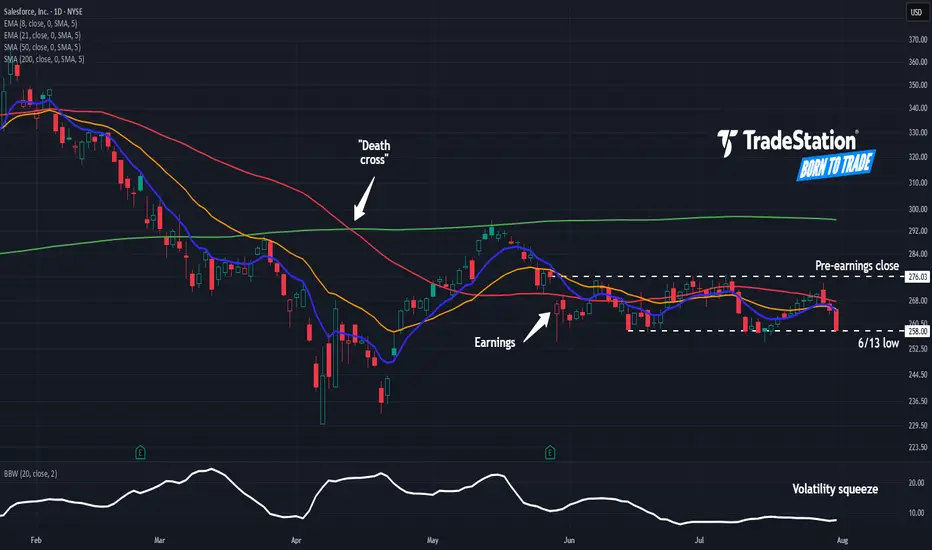
Salesforce May Face DistributionSalesforce has limped as other tech stocks hit new highs, and some traders may think it’s going into distribution.
The first pattern on today’s chart is the bearish price gap on May 29 despite better-than-expected quarterly results. That may reflect waning enthusiasm about the software company’s fu
Key facts today
Next report date
—
Report period
—
EPS estimate
—
Revenue estimate
—
6.47 USD
6.20 B USD
37.90 B USD
931.26 M
About Salesforce
Sector
Industry
CEO
Marc Russell Benioff
Website
Headquarters
San Francisco
Founded
1999
FIGI
BBG000BN2DC2
Salesforce, Inc. engages in the design and development of cloud-based enterprise software for customer relationship management. Its solutions include sales force automation, customer service and support, marketing automation, digital commerce, community management, collaboration, industry-specific solutions, and salesforce platform. The firm also provides guidance, support, training, and advisory services. The company was founded by Marc Russell Benioff and Parker Harris in 1999 and is headquartered in San Francisco, CA.
Related stocks
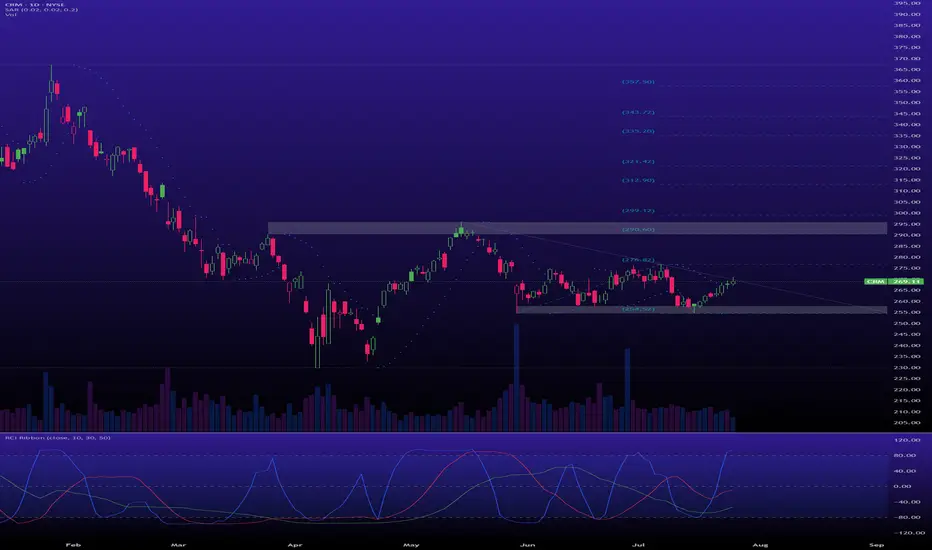
CRM is in an early accumulation phase of the Wyckoff methodWeekly Chart Analysis (The Secret Accumulation):
After a nasty markdown from the highs, CRM entered a wide trading range between roughly $230 and $290. This is classic Wyckoff Accumulation (Phase B) behavior.
Support & Resistance Levels
Next Week (July 28 - August 1, 2025):
Support: Immediate sup
CRM Bullish Double bottom unfolding🚀 CRM Bullish Double bottom unfolding
Ticker : Salesforce, Inc. (CRM)
Timeframe : 1D (Daily Chart)
Setup Type : Potential Double Bottom / Range Breakout
Bias : Bullish Reversal
Technical Breakdown
CRM is showing signs of forming a potential bottoming structure after a sharp decline and a p

CRM Bullish ThesisPOC @ $273.74
ATH was $369 back in December 2024.
ORCL had new ATH a few days ago, and other AI and Cloud names also.
Cloud Service is robust.
MACD on the 5Day Crossing and Curling
Fib 0.618 @ $271 turned into Support, (this Fibo retracement was taken from last move from May 2024 Low to ATH Dec 20

$CRM Long Setup – Coiling at Support with Breakout PotentialSalesforce ( NYSE:CRM ) is consolidating just below the Ichimoku Cloud and building a base around the $265–$270 zone. The MACD is showing early bullish crossover signals with momentum starting to shift, and the price action suggests a coiled spring setup. After multiple tests of the $265 area and a

$CRM Salesforce Trade IdeaStrong support at $260-265 with improving margins (net profit 15-17%). PE ratio down to 41 from 100+ in 2023. 16 analyst BUYs vs 3 SELLs.
Entry: $274-275 Target: $300-305 Stop: $258
Risk/reward ~1:2. Demand zone holding, volume confirms. #StockMarket #Trading

CRM · 4-Hour — Ascending-Triangle Breakout Idea Toward $288→$292Ascending triangle: Since mid-June price has carved higher-lows beneath a flat supply shelf at $276-278.
Coiled energy: Volatility keeps compressing; each dip is met with faster buying—classic “pressure-cooker” price action.
Measured–move math: Pattern height ≈ $18 ($258 → $276). Add that to the b

CRM: Wave Structure Analysis. WaverVanir International LLC · CRM Weekly Outlook · Published June 28 2025
Ticker: CRM | Chart: Weekly
🔹 Catalyst
• Q2 FY26 earnings on August 27 2025 after market close (TipRanks, 2025)
• Dreamforce conference mid September 2025
🔹 Macro Environment
• Fed likely to hold rates at July 30 mee

CRM: Bullish Imbalance Fill in Progress | Targeting Equilibrium 🧠 Salesforce (CRM) shows a clean price reaction from the 61.8–66% retracement zone after bullish CHoCH and internal BOS confirmations. Our Smart Money model detects a re-accumulation beneath prior imbalance zones, with a potential run toward the equilibrium range at ~296–320.
📍 WaverVanir Trade Pla

A force to be reckon with.CRM
The attached image will be of the daily and the weekly timeframe.
On July 2024 of last year the monthly candle of July 2024 had a high of 264.52. Currently in line with closing price of 263.41 today 06/24/25. Will price react the same way a year prior when volume from buyers picked up. The

See all ideas
Summarizing what the indicators are suggesting.
Neutral
SellBuy
Strong sellStrong buy
Strong sellSellNeutralBuyStrong buy
Neutral
SellBuy
Strong sellStrong buy
Strong sellSellNeutralBuyStrong buy
Neutral
SellBuy
Strong sellStrong buy
Strong sellSellNeutralBuyStrong buy
An aggregate view of professional's ratings.
Neutral
SellBuy
Strong sellStrong buy
Strong sellSellNeutralBuyStrong buy
Neutral
SellBuy
Strong sellStrong buy
Strong sellSellNeutralBuyStrong buy
Neutral
SellBuy
Strong sellStrong buy
Strong sellSellNeutralBuyStrong buy
Displays a symbol's price movements over previous years to identify recurring trends.
US79466LAL8
SALESFORCE 21/51Yield to maturity
6.74%
Maturity date
Jul 15, 2051
US79466LAM6
SALESFORCE 21/61Yield to maturity
6.74%
Maturity date
Jul 15, 2061
US79466LAK0
SALESFORCE 21/41Yield to maturity
6.19%
Maturity date
Jul 15, 2041
US79466LAJ3
SALESFORCE 21/31Yield to maturity
4.53%
Maturity date
Jul 15, 2031
US79466LAH7
SALESFORCE 21/28Yield to maturity
4.04%
Maturity date
Jul 15, 2028
US79466LAF1
SALESFORCE 18/28Yield to maturity
3.90%
Maturity date
Apr 11, 2028
See all CRM bonds
Curated watchlists where CRM is featured.


Frequently Asked Questions
The current price of CRM is 252.37 USD — it has increased by 0.63% in the past 24 hours. Watch Salesforce stock price performance more closely on the chart.
Depending on the exchange, the stock ticker may vary. For instance, on NYSE exchange Salesforce stocks are traded under the ticker CRM.
CRM stock has fallen by −6.37% compared to the previous week, the month change is a −6.44% fall, over the last year Salesforce has showed a 1.85% increase.
We've gathered analysts' opinions on Salesforce future price: according to them, CRM price has a max estimate of 440.00 USD and a min estimate of 225.00 USD. Watch CRM chart and read a more detailed Salesforce stock forecast: see what analysts think of Salesforce and suggest that you do with its stocks.
CRM stock is 1.14% volatile and has beta coefficient of 1.31. Track Salesforce stock price on the chart and check out the list of the most volatile stocks — is Salesforce there?
Today Salesforce has the market capitalization of 239.71 B, it has decreased by −2.28% over the last week.
Yes, you can track Salesforce financials in yearly and quarterly reports right on TradingView.
Salesforce is going to release the next earnings report on Aug 20, 2025. Keep track of upcoming events with our Earnings Calendar.
CRM earnings for the last quarter are 2.58 USD per share, whereas the estimation was 2.55 USD resulting in a 1.23% surprise. The estimated earnings for the next quarter are 2.78 USD per share. See more details about Salesforce earnings.
Salesforce revenue for the last quarter amounts to 9.83 B USD, despite the estimated figure of 9.76 B USD. In the next quarter, revenue is expected to reach 10.14 B USD.
CRM net income for the last quarter is 1.54 B USD, while the quarter before that showed 1.71 B USD of net income which accounts for −9.78% change. Track more Salesforce financial stats to get the full picture.
Yes, CRM dividends are paid quarterly. The last dividend per share was 0.42 USD. As of today, Dividend Yield (TTM)% is 0.65%. Tracking Salesforce dividends might help you take more informed decisions.
Salesforce dividend yield was 0.47% in 2024, and payout ratio reached 25.15%. The year before the numbers were 0.00% and 0.00% correspondingly. See high-dividend stocks and find more opportunities for your portfolio.
As of Aug 4, 2025, the company has 76.45 K employees. See our rating of the largest employees — is Salesforce on this list?
EBITDA measures a company's operating performance, its growth signifies an improvement in the efficiency of a company. Salesforce EBITDA is 12.96 B USD, and current EBITDA margin is 34.93%. See more stats in Salesforce financial statements.
Like other stocks, CRM shares are traded on stock exchanges, e.g. Nasdaq, Nyse, Euronext, and the easiest way to buy them is through an online stock broker. To do this, you need to open an account and follow a broker's procedures, then start trading. You can trade Salesforce stock right from TradingView charts — choose your broker and connect to your account.
Investing in stocks requires a comprehensive research: you should carefully study all the available data, e.g. company's financials, related news, and its technical analysis. So Salesforce technincal analysis shows the sell today, and its 1 week rating is sell. Since market conditions are prone to changes, it's worth looking a bit further into the future — according to the 1 month rating Salesforce stock shows the neutral signal. See more of Salesforce technicals for a more comprehensive analysis.
If you're still not sure, try looking for inspiration in our curated watchlists.
If you're still not sure, try looking for inspiration in our curated watchlists.