Cup and Handle Rising Wedge Earnings AMC TodayEarnings are today after market close.
CRM is in a rising wedge but has broken up and out of rising wedges in the past without breaking the bottom trendline. The pattern is not valid unless the bottom trendline is broken. Down the road, after the break up from the rising wedge, CRM encountered a deep pull back and did break the bottom trendline of the wedge it blasted out of when inducted in to the DOW. But it was much later when this happened and CRM made a lot of gains before coming back to meet the bottom trendline of that rising wedge. I do not recall if earnings were due when that happened, just have noted sometimes a rising wedge can hurt you at earnings. Not always. Some stocks blast up and out of this pattern. SNPS did recently.
Rising wedges resemble triangles, but both trendlines slope up. The trendlines narrow at the apex creating a vacuum similar to triangles and contracting bollinger bands. Rising wedges interrupt supply and demand and are bearish in the end. But the end can be in the future or it can be any trading day.
The upper resistance line and lower support line converge as the pattern matures. Bearish confirmation of the pattern does not come until the support line is broken in a convincing fashion. While it is a consolidation formation, the loss of upside momentum on each successive high gives the pattern its bearish bias. However, the series of higher highs and higher lows keeps the trend inherently bullish. The final break of support indicates that the forces of supply have finally won out and lower prices are likely. In a strong stock, price usually finds a support level that exists inside the wedge. I have noticed strong stocks do not fall out as far as a weaker stock will.
No recommendation.
Scared money can equal lost money. Be safe.
CRM trade ideas
CRM looks to form double topsCRM is one of the few stocks in my watchlist that has actually had a green week. After revisiting it seems to make sense.
- The stock fell to $252.19 (September 13), touched the 50 EMA ($252.25), and has been trending up since.
+ MACD line looks to cross the signal line
+ RSI is over 50
- Fibonacci retracements has next level of resistance at $277.11
Some of my other stocks I have charted, in the SPY, look to make one more move up and I am expecting a longer down fall. The potential of CRM double tops offer some level of reassurance that my analysis is correct.

CRM Daily TimeframeSNIPER STRATEGY (new version)
It works ALMOST ON ANY CHART.
It produces Weak, Medium and Strong signals based on consisting elements.
NOT ALL TARGETS CAN BE ACHIEVED, let's make that clear.
TARGETS OR ENTRY PRICES ARE STRONG SUPPORT AND RESISTANCE LEVELS.
ENTRY PRICE BLACK COLOR
TARGETS GREEN COLOR
STOP LOSS RED COLOR
DO NOT USE THIS STROTEGY FOR LEVERAGED TRADING.
It will not give you the whole wave like any other strategy out there but it will give you a huge part of the wave.
The BEST TIMEFRAMES for this strategy are Daily, Weekly and Monthly however it can work on any timeframe.
Consider those points and you will have a huge advantage in the market.
There is a lot more about this strategy.
It can predict possible target and also give you almost exact buy or sell time on the spot.
I am developing it even more so stay tuned and start to follow me for more signals and forecasts.
START BELIEVING AND GOOD LUCK
HADIMOZAYAN

Sales Force : Next Green candle a good signalIn daily, the next candle green will be a good signal to buy.
in frames (1 and 2 hours) it is the end of consolidation phase and may be we will continue the bullish trend.

$CRM BullCRM closed with a bullish engulfing candle on Friday. It also out performed itself on earnings which is a good sign that this pair will run in the week as well. If it breaks the 4H resistance level I speculate that it will continue to My target profit in the blue box. have to wait on pre market to see how it performs.

$CRM - Weekly cup shape, calls above 268, puts below 261$CRM - Weekly cup shape, calls above 268, puts below 261

CRM bullishsaw some above avg bullish vol friday. Leaving a piercing line. Bouncing at the 382 fib level
if it falls below $262 level, looking for the 20 daily SMA to be the next support at the 50% fib level
buying calls above 267.41

$CRM with a Bullish outlook following its earnings #Stocks The PEAD projected a Bullish outlook for $CRM after a Positive over reaction following its earnings release placing the stock in drift B with an expected accuracy of 88.89%.
If you would like to see the Drift for another stock please message us. Also click on the Like Button if this was useful and follow us or join us.

Inverse Bat PatternOnly GAMBLE the money you are willing to lose!
Short plays here. Do take some profits along the way down.

Salesforce - Wait for a good Entrance!-SalesForce, a great company to buy. Currently is going through a bearish run which will possibly end after another 1-2% drop.
-We are waiting for it to find the support at which level we are planning to enter to our position with CRM.
-Possible support is expected to come at around $260-$261.


crm shortcup and handle.. 1st support level and tp1 at251. ..252.. 2nd support level and tp2 at 234 ...236

CRM Bearflagging after rejection at top of channel Will likely pullback to 260 next week.
(Not advice, opinion only).

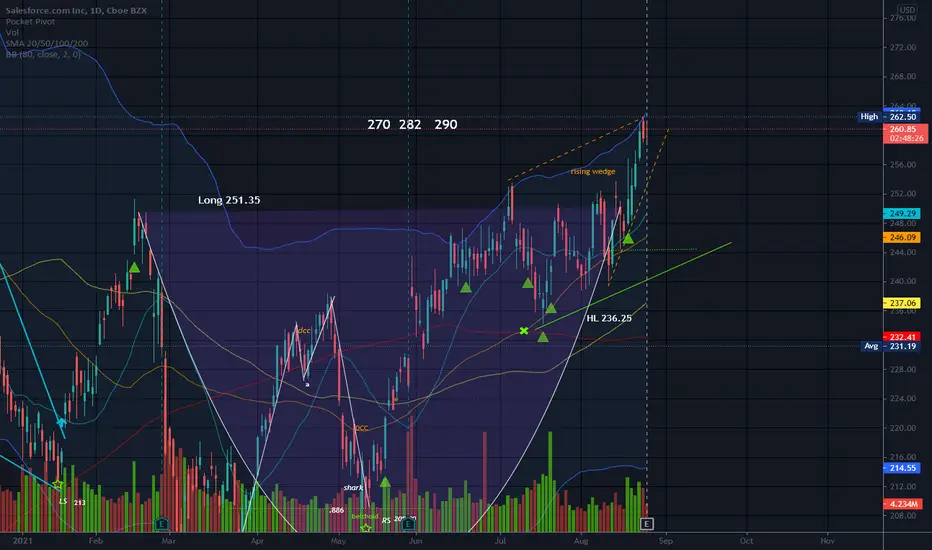
CRM ContinuationCRM broke outside the descending channel and it is setting up for some continuation.
Waiting for entry above 251.25 with targets at 266.40 and ATH

CRM in the way to reach ATHCRM is a market leader and has been breaking earnings for almost a year, this time I think it will reach all-time high again and we'll see how it goes from there.

Trade Idea $CRM #momentumtradeThis is not financial advise
This are trade Ideas
Of stocks that are in a
Momentum set up
Trending upwards

Salesforce Ponzied - Double Top - Large Cap Stonksvaluation matters. Seems to have caught the $doge buzz. Buy Buy Buy. lol
NO.
Profit TODAY matters most in *rising rates environment.

Salesforce Analysis 24.08.2021Hello Traders,
welcome to this free and educational analysis.
I am going to explain where I think this asset is going to go over the next days/weeks and where I would look for trading opportunities.
If you have any questions or suggestions which asset I should analyse tomorrow, please leave a comment below.
I would also appreciate, if you would smash that like button and help me to create more free analysis like that.
Thank you for watching and I will see you tomorrow!

CRM active setup. Let's see how this performsToday we will talk about CRM. Here we have an active setup, and we will explain why we decided to develop it this way.
Main structure: The most important aspect of the chart before the entry was executed, was this huge Flag pattern above a dynamic support resistance level. We were waiting for a breakout of the structure before developing setups. Also, we could observe 0 resistance levels after that.
Time Horizon: When you are trading a big structure, you must understand that these types of setups take a lot of time to evolve. However, that's not a problem if you know how to handle your anxiety and have other setups or strategies running with this.
The target: Is a convergence between fibo extensions and an ascending channel that is not defined yet (we need a new ATH to confirm it. However, if that happens, the alignment is pretty good.
Activation Level: Our entry price is always above minor resistance zones of the corrective pattern, or in other words, "Always above B." That way, we avoid a lot of fakeouts.
Invalidation Level: IF everything goes wrong, the invalidation level we have is below the structure. There we will automatically close our setup losing 1.5% of our Capital.
Thanks for reading!

Update: Salesforce.com Inc: - Take Profit HereThe share is trading in the upper end of my 'take profit' zone (now at $261). Not a fast mover, but target range has been hit. Earnings due Wednesday however I would consider banking here, to avoid 'event risk'.
Original idea attached.

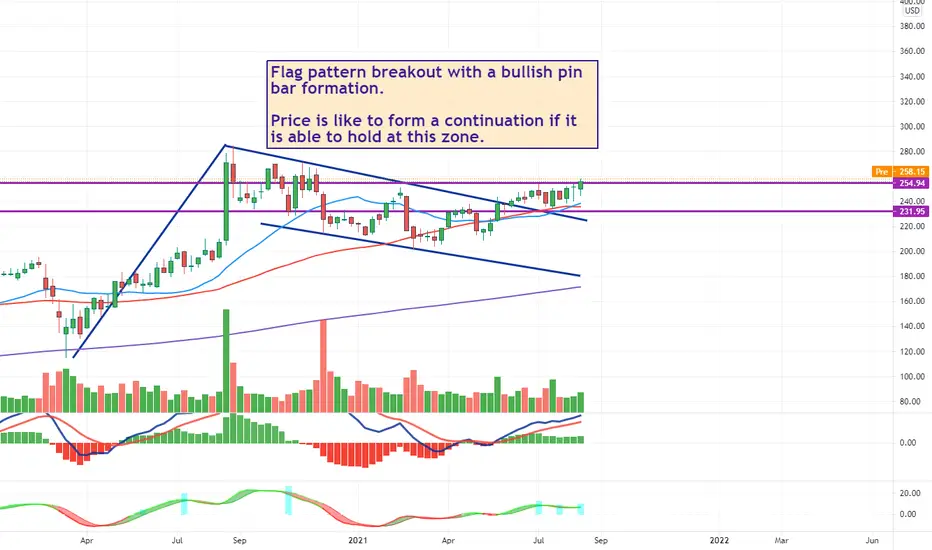
Salesforce.com (CRM - NYSE)Flag pattern breakout with a bullish pin bar formation.
Price is like to form a continuation if it is able to hold at this zone.
CRM 20-07-2021 LongAsset and Time frame -CRM,1D
Entry Price -240.41
Exit(Stop Loss) -235.52
Exit(Take Profit) -256.15
Technical Analysis -Price has been going upwards in a daily trend line channel, price reacted strongly to the median line with a hammer and now confirmation candle(when the candle close), volume has been picking up the last few days.

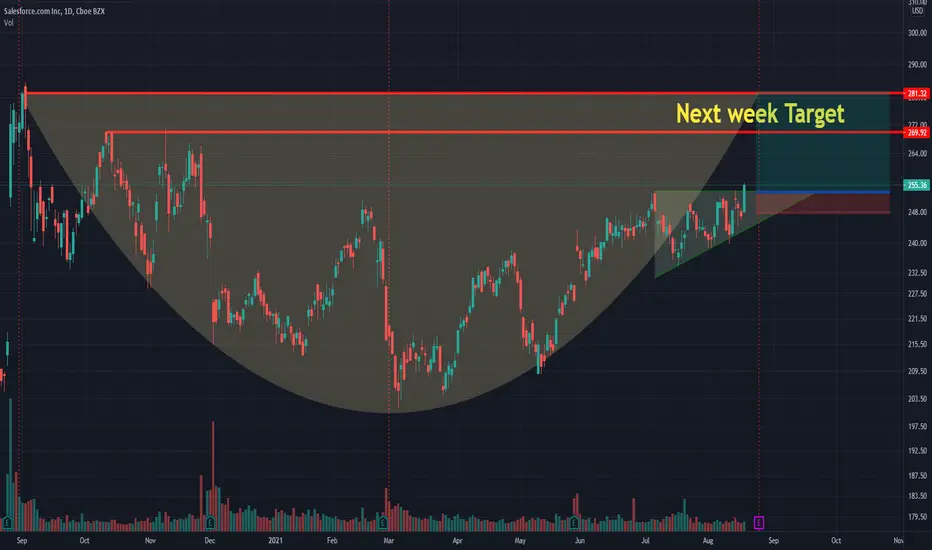
Next week targetEntry: 253-255
Stop loss: 244
Reward/Risk:5
Target range: 280-300
Time Frame: 1-2wks
Possible gain: 11.2(20% for second target)
Possible loss: 2.2%