CRM Continues UpToo far up too fast. Long above that channel. Under the hood factors look like it's a real move. Software tends to be inversely correlated with a sharp rise again in the ten year note yield. In the fall we might see another event like that.
CRM trade ideas

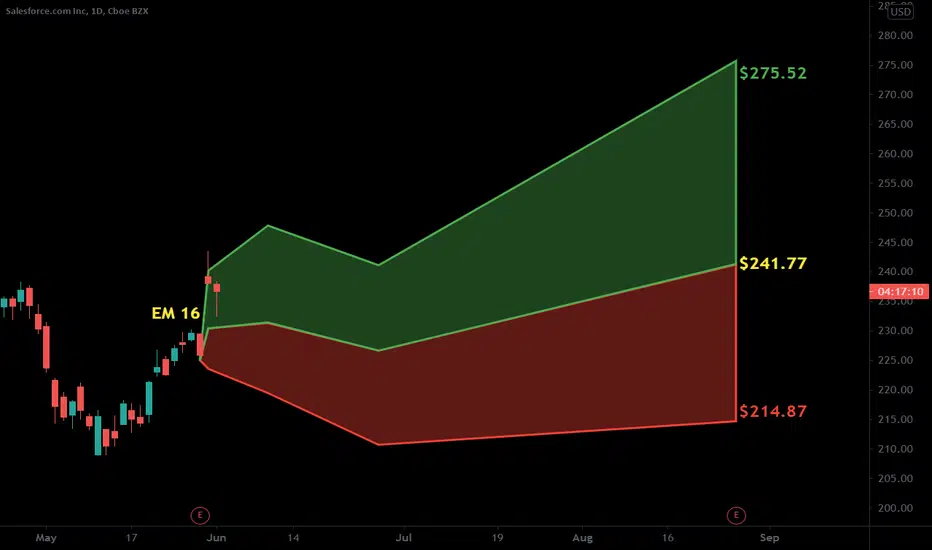
CRM potential to 240-250 after ERCRM has been trading in a descending price channel for a while now. Expecting strong quarterly report in May and price rising to 240-250.


CRM FIBO BOUNCEprice at a previous support, with a 4TH unsuccessful attempt to break out. key fibo zone for bounces and above trend line of lower lows.
TP1 $ 233
tp2 $ 260
Important note: ⚠️ All trades have risks that the investor must consider before investing. VivirdelTrading.club makes a disclaimer of any operation that may generate losses. All information transmitted by the channel, the page and the alert system is shared in good faith. There is no guarantee of 100% of the executed operations, as these are based on statistical models and assumptions regarding the past behavior of the price of a share, but they do not guarantee the same future behavior.


CRM long the down trend line breakCRM earnings beat and guidance up recently causing the stock to gap up above the downtrend line , breaking it
retest it and seems to have buyer coming in Long the setup with a call option debit spread


Salesforce (CRM) - Breakout is ImminentWe have early signs of a breakout above previous swing high, combined with a bullish triangle pattern. Although this pattern is not yet confirmed, a H4 close above is likely to trigger a strong bullish move.

$CRM | Bull Flag Breakout: Watch For Upside Continuation$CRM broke out of a massive bull flag on the daily timeframe.
Price has already retested and bounced off of the flag structure.
Watch for continuation to the upside.
Initial Targets: $250, $265

CRM stocks on the way to ATH again?Hi every one
SALEFORCE
This the SALEFORCE.COM INC stocks. this company's central office is in san Francisco ,USA. recent reports of this company has been very Impressive! on the technical side we can see that the Price has been In a Descending channel for a few months. but now the price has managed to break this channel upwardly so there is a strong chance the price of the stocks would Increase from this Point. the price can easily Increase to It's ATH once again!
Traders, if you liked this idea or have your opinion on it, write in the comments, We will be glad.
Thank you for seeing idea .
Have a nice day and Good luck

Inverse Head and ShouldersCRM appears to be struggling big time at the neck line. 2 strikes so far.
Long entry level is a break of the neckline with an uptrend in tact.
Inverse head and shoulder bottoms usually do well in a bull market, but not so hot in a bear market.
Possible stop below 223.60 or last pivot low. or the lowest shoulder depending on how conservative you are with stops.
The top wicks on the 2 attempts to break the neckline are long with one resembling a shooting star. The bulls fought to get price to the top of the top wick, but the bear took took them to a price below the open that day which is the top of the body on a red candle. The top wick representing the high of the day and the bottom shadow/wick representing the low for the session.
No recommendation

Salesforce Inc - Q1 Results Supportive of Technical StructureSalesforce recently reported it's Q1 results with reported revenue of $5.96 billion up 23% from a year ago. The top-line figure came in ahead of both the company’s guidance range of $5.875 billion to $5.885 billion and the Street consensus at $5.89 billion.
According to Barron's, 'for the January 2022 fiscal year, the company sees revenue of $25.9 billion to $26 billion, with non-GAAP profits of $3.79 to $3.81 a share, ahead of the former Street consensus at $25.8 billion and $3.43. The company said the full year includes about $500 million in contributions from Slack Technologies. Salesforce expects its acquisition of Slack to close toward the “very end” of the fiscal second quarter.'
“We had the best first quarter in our company’s history,” CEO Marc Benioff said in a statement. “We’re on our path to reach $50 billion in revenue in FY 2026.”
Technically , the share has been in a multi-month downward channel, peaking at 284.50 in September 2020 however on the back of the earnings release, the share breached the channel which was followed by a back-test/re-test. We also note the share breaching the mid-point of a 'W' formation, further supporting a directional shift from neutral to moderately bullish.
The share is a buy provided $229 is held.
On the upside, the targets are the $252 to $263 range.
Last: $238.14

$CRM out of the channel$CRM broke the channel after earnings report, if you look at the daily chart you can see it retested the trend line and now is working on its way up. looking to enter with a small position over 238.50 for the long side and will add more is if goes over 141. Targets 141/143.50

CRM previous resistance held as supportCRM broke out of a trendline resistance and retested it as support. Watching price action for a day trade/swing trade.

i like CRM CRM breakout and retest i think it'll break back out to $250s ish and if the market is crazy bullish $280-$300
they beat earnings breaking out of a flag and pennant

Trading Idea - #Salesforce short-termBUY
ENTRY: 217.60 USD
TARGET: 234.56 USD (+8 % profit)
STOP: 207.66 USD
Salesforce is the world's leading provider of customer relationship management (CRM) software.
1.) Testing the support at $ 209.95 provides good timing for buying the security.
2.) The growth in recent years is one of the company's strengths. A further growth of 70% is forecast over the next 3 years (until 2004).
3.) Salesforce is in a great financial position, which gives it immense investment capacity.
4.) But beware! The ratio of "company value to sales" places the company among the world's most expensive companies.
5.) The trend in the last 10 months is clearly negative. Therefore, I only see a short-term buying opportunity.
6.) With a clear breakout of the downward channel, new possibilities arise!


$CRM with a Bullish outlook following its earnings #Stocks The PEAD projected a Bullish outlook for $CRM after a Positive over reaction following its earnings release placing the stock in drift B
If you would like to see the Drift for another stock please message us. Also click on the Like Button if this was useful and follow us or join us.
CRM Clean Channel Breakout! - Clean descending trendline breakout on increased volume! PEG Candle formed on shorter time frames due to great earnings beat.
- At POC Volume shelf.
- MACD crossing.
Will scout for an entry on the retest and/or when the MA's catch up.


