Short position in anticipation of correction before the quarterlOver the past month, you can find a channel in which the stock is traded.
With a Stop Loss of 2.5%, the trade gives a good risk-to-profit ratio.
CTVA trade ideas

CTVA,,, Buying opportunity Uptrend
It seems, it is rising powerfully after a breakout and small pullback to broken level. High risk traders can get it regardless of the correction on indices. I suppose 58 can be a sure spot for setting up a SL and the next target has been shown on the chart.

CTVA - 8 months RECTANGLE══════════════════════════════
Since 2014, my markets approach is to spot
trading opportunities based solely on the
development of
CLASSICAL CHART PATTERNS
🤝Let’s learn and grow together 🤝
══════════════════════════════
Hello Traders ✌
After a careful consideration I came to the conclusion that:
- it is crucial to be quick in alerting you with all the opportunities I spot and often I don't post a good pattern because I don't have the opportunity to write down a proper didactical comment;
- since my parameters to identify a Classical Pattern and its scenario are very well defined, many of my comments were and would be redundant;
- the information that I think is important is very simple and can easily be understood just by looking at charts;
For these reasons and hoping to give you a better help, I decided to write comments only when something very specific or interesting shows up, otherwise all the information is shown on the chart.
Thank you all for your support
🔎🔎🔎 ALWAYS REMEMBER
"A pattern IS NOT a Pattern until the breakout is completed. Before that moment it is just a bunch of colorful candlesticks on a chart of your watchlist"
═════════════════════════════
⚠ DISCLAIMER ⚠
Breakout Area, Target, Levels, each line drawn on this chart and any other content represent just The Art Of Charting’s personal opinion and it is posted purely for educational purposes. Therefore it must not be taken as a direct or indirect investing recommendations or advices. Entry Point, Initial Stop Loss and Targets depend on your personal and unique Trading Plan Tactics and Money Management rules, Any action taken upon these information is at your own risk.
═════════════════════════════

CTVA,,, WatchingUptrend
Passing out of a price level has been important for me especially if the level is major one.
I will get this position if it confirmed above this level properly by setting a SL about 53 and targeting around previous high.

Top stock picks for the next years No 9 Corteva Inc.I am publishing a series of the best stocks with the highest growth rates that I expect over the next few years. Today with the Corteva share with a target price of 91$

CORTEVA Stock Chart Fibonacci Analysis 121923 Trading Idea
1) Find a FIBO slingshot
2) Check FIBO 61.80% level
3) Entry Point > 45/61.80%
Chart time frame : C
A) 15 min(1W-3M)
B) 1 hr(3M-6M)
C) 4 hr(6M-1year)
D) 1 day(1-3years)
Stock progress : A
A) Keep rising over 61.80% resistance
B) 61.80% resistance
C) Hit the bottom
D) Hit the top
Stocks rise as they rise from support and fall from resistance. Our goal is to find a low support point and enter. It can be referred to as buying at the pullback point. The pullback point can be found with a Fibonacci extension of 61.80%. This is a step to find entry level. 1) Find a triangle (Fibonacci Speed Fan Line) that connects the high (resistance) and low (support) points of the stock in progress, where it is continuously expressed as a Slingshot, 2) and create a Fibonacci extension level for the first rising wave from the start point of slingshot pattern.
When the current price goes over 61.80% level , that can be a good entry point, especially if the SMA 100 and 200 curves are gathered together at 61.80%, it is a very good entry point.
As a great help, tradingview provide these Fibonacci speed fan lines and extension levels with ease. So if you use the Fibonacci fan line, the extension level, and the SMA 100/200 curve well, you can find an entry point for the stock market. At least you have to enter at this low point to avoid trading failure, and if you are skilled at entering this low point, with fibonacci6180 technique, your reading skill to chart will be greatly improved.
If you want to do day trading, please set the time frame to 5 minutes or 15 minutes, and you will see many of the low point of rising stocks.
If want to prefer long term range trading, you can set the time frame to 1 hr or 1 day.

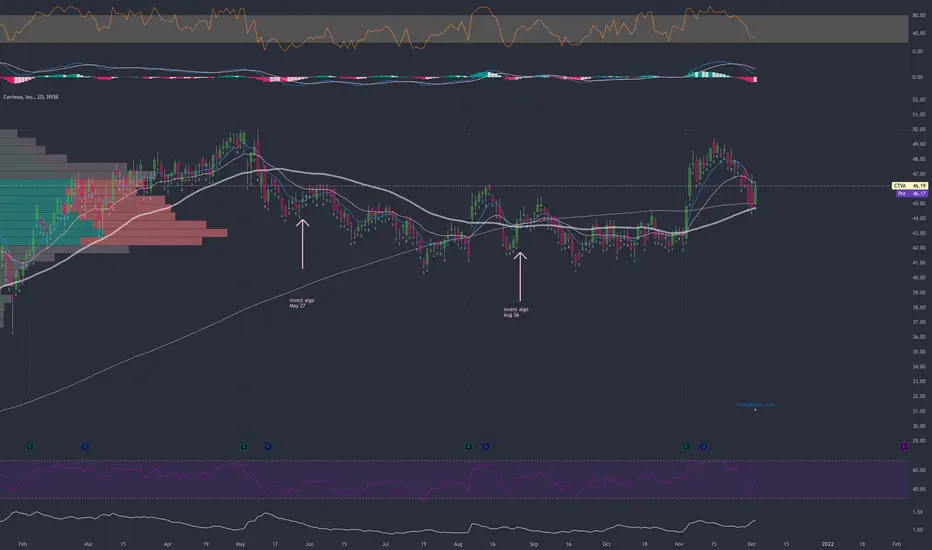
Something differentAgriculture commodities are coming back up pushing this stock up as well. I opened a small position today but I think is going to pull back so I'll add then. Looks like a bearish channel but also like a bull flag, either way it bounced off the bottom very hard and I think it will eventually break out. I could take a few weeks, be patient.

$CTVA with a Bullish outlook following its earnings #Stocks The PEAD projected a bullish outlook for $CTVA after a Negative under reaction following its earnings release placing the stock in drift D.

$CTVA with a Bullish outlook following its earnings #Stocks The PEAD projected a Bullish outlook for $CTVA after a Negative over reaction following its earnings release placing the stock in drift C.

CTVA bull flaggingCTVA had a nice uptrend recently but has had a healthy pull back to the 78.6 fib, which it has held and now looks like it's flagging. In this choppy market, it's holding up well

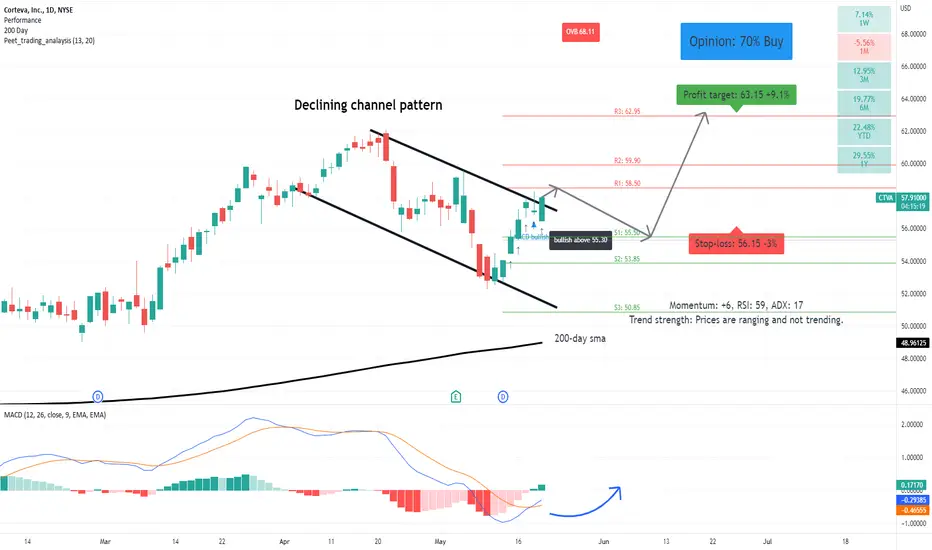
CTVA: bullish confluence breakStarting to break out of the declining channel pattern.
A price action above 55.30 supports a bullish trend direction.
Remains above its 200-day simple moving average.
Upside price momentum supports the bullish trend direction.
RSI leaves enough room for further upside price potential.
MACD crossover also confirmed a change in trend direction to bullish.

CTVA New All Time HighsCTVA gapped up yesterday and made a New All Time Highs
Breakout Confirmed
Missed last earning by 5%
But overall earnings are fine
Volume is trading slightly above 50DMA
Pays out dividends


$CTVA could be headed higher if it breaks above $52.24* Strong up trend
* Sector: Basic Materials - Agricultural Inputs
* RS vs. Sector: 3.42
* RS vs. SP500: 2.17
* U/D Ratio: 1.7
* Base Depth: 20.18%
* Distance from breakout buy point: 5.56%
* Volume 39.11% above its 15 day avg.
* For the past 4 weeks $CTVA as been ranging between $49.24 and $52.24 while the general market has been falling.
* A U/D ratio of 1.7 shows that $CTVA is being accumulated
* A break above $52.24 could prove to be meaningful
Trade Idea:
* Wait for a break above $52.24 as a sign of confirmation that the stock is ready to move higher.

CTVA - Corteva, Inc.Stock recently broke out of a ~10 month base and is forming a very tight VCP / high handle.
The stock continues to make new relative strength highs, giving very little back while the indexes struggle, showing its superior strength relative to the overall market.
Look for a breakout over the February 9 closing print of $51.54 with a stop just below the low of the VCP.

CTVA Bearish SetupThe asset Has now shown great amount of weakness prior to making an All-time high. This can be a worthy setup for a short swing. Keep in mind Fed's meeting on Wednesday can bring in great amount of volatility to the market.

CTVA breaking out of an 8 month cup and handle?* Exceptional earnings
* Very strong up trend
* High 3-month relative strength of 1.24 in the Basic Materials sector
* Pays out dividends and two quarters back it increased its dividends
* Breaking out of a cup and handle pattern
* Also offering a pocket pivot entry
* Base of the cup is ~8 months long and ~17.6% deep
* The stock is relatively new and this is it's 2nd stage base
Trade Idea:
* You can enter now as it's just breaking out of the handle and is offering a great risk/reward ratio

$CTVA - golden crossOne of my favorite patterns to play is the golden cross.
This one is set for movement. Going to set alerts to detect the move.
CTVA bullishCorteva, Inc.
Corteva, Inc. - CTVA has a BULLISH trend
Argus
Outlook:Bullish
Long Term Target:54.00
Current Price:46.01
On August 5, Corteva reported an adjusted 2Q21 operating profit from continuing operations of $1.043 billion or $1.40 per share, up from $944 million or $1.26 per share in the prior-year period.
The higher earnings reflected higher pricing and volume gains in both business segments, which more than offset cost headwinds. Net revenue grew 8% to $5.627 billion.


Cup and HandleOVERBOUGHT right now
Bullish with high NV
There is also an ABC bullish pattern
Corteva, Inc. operates in the agriculture business. It operates through two segments, Seed and Crop Protection. The Seed segment develops and supplies advanced germplasm and traits that produce optimum yield for farms. It offers trait technologies that enhance resistance to weather, disease, insects, and weeds, as well as food and nutritional characteristics. This segment also provides digital solutions that assist farmer decision-making with a view to optimize product selection, and maximize yield and profitability. The Crop Protection segment offers products that protect against weeds, insects and other pests, and disease, as well as enhances crop health above and below ground through nitrogen management and seed-applied technologies. This segment provides herbicides, insecticides, below-ground nitrogen stabilizers, and pasture and range management herbicides. It serves agricultural input industry. The company operates in the United States, Canada, Latin America, the Asia Pacific, Europe, the Middle East, and Africa. Corteva, Inc. is headquartered in Wilmington, Delaware.
Not a recommendation

CTVA 4D:: Best level to BUY // 40%+ SWING trade (STOCKS)Why get subbed to to me on Tradingview?
-TOP author on TradingView
-15+ years experience in markets
-Professional chart break downs
-Supply/Demand Zones
-TD9 counts / combo review
-Key S/R levels
-No junk on my charts
-Frequent updates
-Covering FX/crypto/US stocks
-24/7 uptime so constant updates
CTVA 4D:: Best level to BUY // 40%+ SWING trade (STOCKS)
IMPORTANT NOTE: speculative setup. do your own
due dill. use STOP LOSS. don't overleverage.
🔸 Summary and potential trade setup
::: CTVA 4days/candle chart chart overview
::: strong bullish chart
::: symm triangle breakout
::: strong recovery in progress
::: measured move TP is 40% gains
::: TP bulls is 38+ 40% gains
::: expecting strong gains next few weeks
::: next SWING is going to be 40%+ gains
::: well defined symm trn breakout
::: STRATEGY: BUY/HOLD at market
::: BUY/HOLD swing trade setup / patient traders
::: 40%+ gains on BUY SIDE medium-term
::: good luck traders
🔸 Supply/Demand Zones
::: N/A
::: N/A
🔸 Other noteworthy technicals/fundies
::: TD9/Combo update: N/A
::: Sentiment: BULLS
::: Sentiment outlook short-term: BULLS
