CVX on the Radar! Carefully Picked for a High-Conviction Trade!Market Structure Overview:
* CVX is currently trading in an ascending channel, showing higher highs and higher lows—a sign of bullish momentum.
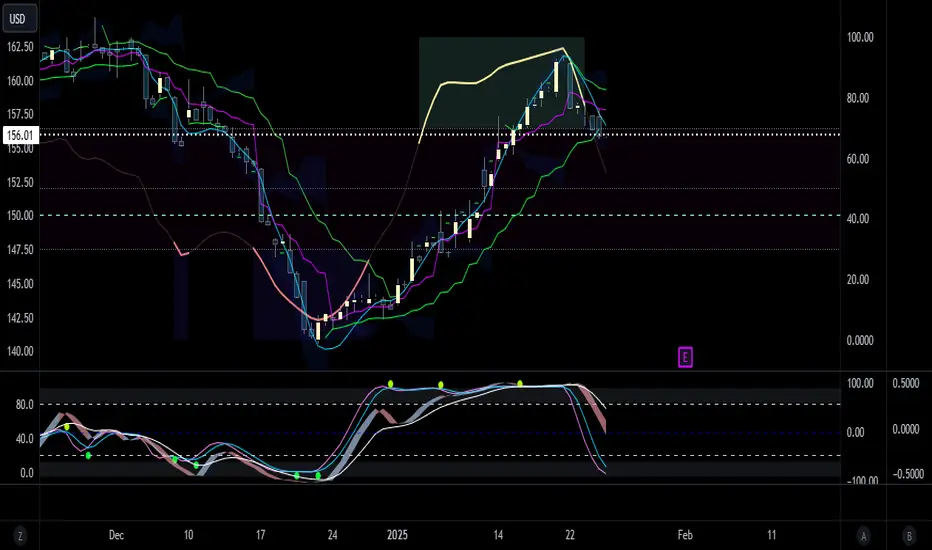
* The stock recently hit a high of $158.71 and is now pulling back slightly, testing support near $155.77 - $155.23.
* A breakdown below $155.23 could lead to further selling pressure toward the next support at $151.06.
Key Support & Resistance Levels:
* Resistance:
* $158.71 (Recent High)
* $160+ (Potential breakout target if momentum continues)
* Support:
* $155.77 - $155.23 (Current support zone within the trend)
* $151.06 (Major breakdown level)
Indicators Analysis:
* MACD:
* The MACD is showing signs of weakness as the histogram is declining. This suggests momentum may be cooling off.
* A bearish crossover on the MACD lines would further confirm short-term downside risk.
* Stochastic RSI:
* The Stoch RSI is at the bottom, indicating that the stock may be oversold in the short term and could soon see a bounce.
* If it curls back up, it could provide a bullish entry signal.
Price Action Insights:
* The stock has been following an uptrend, but a short-term pullback is developing.
* A break above $158.71 could send CVX to $160+, while a failure to hold $155.23 could lead to a deeper pullback toward $151.06.
* Volume is relatively stable, but a spike in either direction would confirm the next move.
Trade Scenarios:
✅ Bullish Setup:
* Entry: Near $155.50 - $156.00 (If support holds)
* Target: $158.71 → $160
* Stop Loss: Below $154.50 (Break of trend)
❌ Bearish Setup:
* Entry: If price breaks below $155 with high volume
* Target: $151.06
* Stop Loss: Above $157
Final Thoughts:
* CVX is bullish but showing short-term weakness.
* Watch the $155.23 level for a bounce or breakdown.
* A break above $158.71 could trigger a strong upside continuation.
🚀 CVX is in an uptrend, but watch for potential pullbacks before entering new trades!
📌 Disclaimer: This analysis is for educational purposes only and is not financial advice. Always do your own research and risk management before trading.
CVX trade ideas

Chevron Heading Underground. CVXA bearish outlook on this situation from a purely technical standpoint. The amalgamation of factors make for a convincing picture. There is a break of MIDAS line, price action cross of US and vWAP line, cross of US/vWAP lines, negative volatility zone oscillations, negative stochastics, trigger cross of downgoing vzo ribbon. And to top it off, exit out of the OBOS territory by the momentum indicator. Good luck out there!
CVX Tests Major Resistance! Can the Bulls Keep the Momentum?Technical Analysis Overview:
1-Hour Chart:
* Trend: CVX remains in a strong uptrend, approaching key resistance near $157.5.
* Indicators:
* MACD: Displays slight bullish momentum, but histogram is flattening, signaling possible consolidation.
* Stochastic RSI: Overbought at 87, indicating potential short-term exhaustion.
30-Minute Chart:
* Price Action:
* CVX is consolidating near $157, just under key resistance at $157.5-$160.
* Support at $155 has held firmly, demonstrating buyer strength in this range.
* Volume: Moderate volume indicates steady buying pressure.
Key Levels to Watch:
Support Levels:
* $155: Immediate support level and highest positive NETGEX.
* $152.5: Next support zone, aligning with GEX10.
* $148: Strong support near the 3rd PUT Wall.
Resistance Levels:
* $157.5: Immediate resistance, coinciding with the 3rd CALL Wall.
* $160: Major resistance, aligning with the 2nd CALL Wall.
* $165-$170: Long-term resistance zones with significant CALL walls.
GEX Insights:
Key Gamma Levels:
* Positive Gamma Walls (Resistance):
* $157.5: Highest positive NETGEX and immediate resistance.
* $160: 82.85% (2nd CALL Wall).
* $165-$170: Major resistance levels (12.8%-19.94% GEX).
* Negative Gamma Levels (Support):
* $155: Strong support aligned with highest positive NETGEX.
* $148: Backed by significant PUT support (-0.89% GEX).
Options Metrics:
* IVR: 41.4, indicating moderate implied volatility.
* IVx: 23.3, slightly below average.
* Call/Put Bias: PUTs dominate at 22.7%, showing caution in the market.
Trade Scenarios:
Bullish Scenario:
* Entry: Above $157.5 with volume confirmation.
* Target: $160-$165.
* Stop-Loss: Below $155 to limit downside risk.
Bearish Scenario:
* Entry: Rejection at $157.5 or a breakdown below $155.
* Target: $152.5-$148.
* Stop-Loss: Above $160 to control losses.
Directional Bias:
* CVX is consolidating below a critical resistance zone at $157.5. A breakout could lead to bullish momentum toward $160-$165, while failure to break higher may result in a pullback to $155 or lower.
Conclusion:
CVX is approaching a crucial inflection point near $157.5. Traders should monitor this level for signs of a breakout or rejection. A decisive move above $157.5 could signal further bullish continuation, while a breakdown below $155 may signal consolidation or a retracement.
Disclaimer:
This analysis is for educational purposes only and does not constitute financial advice. Always conduct your research and trade responsibly.

Major Price Movement Incoming for CVX!Signalist has detected a precise pattern in NYSE:CVX trading activity, signaling that a substantial price movement is imminent. This isn’t a random fluctuation—it’s a carefully analyzed precursor to a significant market event.
📅 What to Expect:
⌛ Timeline: Anticipate a major move within the next 1 to 4 upcoming 3-hour candles.
📈 Monitor the Charts: Keep an eye on CVX’s price action over the next few candles.
Prepare Your Strategy: Whether you’re bullish or bearish, have your trading plan ready to capitalize on the move.

CVX long positionhi traders,
Looking at the daily graph for Chevron Corporation (CVX), we can
expect a possible price reversal scenario. The stock recently has
been seen at support level of around $144 and has started depicting consolidation evidence. The price can be seen forming a possible structure for a bullish recovery; therefore, a rebound from this zone could open the pathway for further upside momentum.
Risk-reward ratio: 3,53
The trading idea is based on technical analysis.
The price established a range and after revisiting the bottom of the range, we expect the price to retest the top of the range again.
The entry, target and stop loss are shown on the chart.
Good luck

Chevron: Progress!Chevron has dropped decisively, significantly advancing our primary scenario. In this scenario, we expect the ongoing turquoise wave 2 to find its low just above the support at $135.37, which should set the stage for fresh upward movement. In the meantime, the probability of our alternative scenario has been reduced to 32%. Still, the possibility of an already established low of the turquoise wave alt.2 and, thus, a direct breakout above the resistance at $166.91 should be considered.

Testing...Looks a test of the broken resistance. Also could be a false breakout. I bought calls anyway 01/17 strike 170. If it is a test, it should go up very fast.

"This Price Action Reminds Me Of 3 Chart Patterns.."Yesterday i was trying to talk to some
youthful people as they did not understand
the value of value.
It really angers me when people don't understand
me and this type of emotion can be very selfish
but I always have to remind myself that I am
a leader and as a leader its my duty
to be the best version of myself
and control my emotions.
The market is on fire again
These past few days the market was silent
right now we are looking at the price of oil
because this NYSE:CVX is an oil company
Yesterday we looked at the gold price
and I explained to you
the rocket booster strategy
To learn more and reread yesterday
article check out the
resources below
This chart pattern is a little bit confusing
it reminds me of 3 chart patterns
(1) Gravestone doji
(2) The long Upper shadow
(3) The hammer
Which of these 3 do you think it is?
There is a lot of conflict
during this end of the year maybe this
could be the reason
For the energy sector to be on fire.
Rocket boost this content to learn more
Disclaimer: Trading is risky
please learn risk management and profit-taking
strategies
because you will lose money whether you like it or not
and feel free to use a trading simulation tool
before you
trade with real money.

Chevron_CVX_1WChevron shares are active in the field of oil and energy and it is a suitable trading and investment position. This symbol is based on the Elliot waves in the rising wave, which can move to rise for the 5th wave in the long term due to the completion of the 4th correction wave. The suitable range of purchase is 160.00 Target wave 5 pieces 220.00

Chevron (CVX): Bottom in Sight?Chevron ( NYSE:CVX ) has maintained a wide range between $167 and $137 since March 2022, with one notable push above this range likely corresponding to the completion of wave 3. The focus is now on identifying the wave 4 bottom, which we anticipate to form between the 50-61.8% Fibonacci retracement levels, or $128–$113. This range is supported by key technical indicators, including a High Volume Node Edge and a Point of Control (POC) within this area, adding significant confluence.
From a macroeconomic perspective, Chevron faces challenges from declining crude oil prices, which is impacting investor sentiment. Despite a brief surge in oil-and-gas stocks following Donald Trump’s victory, this momentum has not sustained across the sector. Broader bearish factors such as weak Chinese demand, global overproduction, and OPEC’s indecision on further cuts add to the uncertainty. Bullish bets on oil due to geopolitical tensions have largely underperformed over the last two years, further pressuring the commodity and Chevron.
Should NYSE:CVX reclaim the range high at $167, it could signal a trend reversal, suggesting the wave 4 bottom may already have formed at $135.55, the last significant low. However, if the resistance holds, further downside into the targeted area seems likely.
We will continue monitoring how global tensions, oil price fluctuations, and broader market conditions impact Chevron’s performance. Until then, patience is key as we await a clear signal.

Looking for a leap on CVX!🔉Sound on!🔉
Thank you as always for watching my videos. I hope that you learned something very educational! Please feel free to like, share, and comment on this post. Remember only risk what you are willing to lose. Trading is very risky but it can change your life!

CVXan upward trend in the prices of an industry's stocks or the overall rise in broad market indices, characterized by high investor confidence

Could Chevron ($CVX) Surpass $175 with Its Bullish Surge? Could Chevron ( NYSE:CVX ) Surpass $175 Amid Its Bullish Surge?
What do you think? Is $175 in sight for #CVX? Share your predictions and let's discuss the potential of this energy giant in the comments below!
#StockMarket #Chevron #EnergySector #Investing #Finance

CHEVRON Ideal sell at the top of the 2-year Channel Down.Chevron (CVX) has been trading within a long-term Channel Down since the November 14 2022 High (almost 2 years). The price is currently on a 4 week rejection streak on the 1W MA50 (blue trend-line) but despite the selling pressure, it closes every 1W candle flat, refusing to decline.
This is most likely the same accumulation/ pull-back phase that the previous two Bullish Legs went through upon testing the 1W MA50. They both eventually broke it and peaked at the top of the Channel Down.
We expect a similar peak within the 1W MA100 (green trend-line) and the 1W MA50. Once the 1W RSI also peaks and starts reversing (red arc), we will sell and target 132.00 (just above the 1.236 Fibonacci extension).
-------------------------------------------------------------------------------
** Please LIKE 👍, FOLLOW ✅, SHARE 🙌 and COMMENT ✍ if you enjoy this idea! Also share your ideas and charts in the comments section below! This is best way to keep it relevant, support us, keep the content here free and allow the idea to reach as many people as possible. **
-------------------------------------------------------------------------------
💸💸💸💸💸💸
👇 👇 👇 👇 👇 👇

Oil to da moohnThe horizontal grey lines are yield curve inversion dates.
Just take a moment to look at the long term trend, then the similarities to prior cycles
(used some green and red circles to help visualize)
200 week SMA has just tested as support as well.
Williams % monthly bottomed out
Bullish div on monthly MACD
I prefer buying OXY over CVX but some people like the dividend here.
I have to say though, the divvy and buybacks on OXY will be crazy good once they pay off debt.

"Inverse Head and Shoulders" pattern formed on CVX!🔉Sound on!🔉
Thank you as always for watching my videos. I hope that you learned something very educational! Please feel free to like, share, and comment on this post. Remember only risk what you are willing to lose. Trading is very risky but it can change your life!

Chevron (CVX) Stock Rallies Amid Middle East TensionsChevron (NYSE: NYSE:CVX ), along with other energy giants like ExxonMobil and ConocoPhillips, has been making significant gains as oil prices surge due to heightened tensions in the Middle East. The geopolitical instability, particularly Iran’s missile strike on Israel, has raised concerns over potential disruptions in global oil supplies, driving up crude prices and, consequently, energy stocks.
Overview
Brent crude, the global oil benchmark, rose 2.8%, reaching $75.59 per barrel, while U.S. West Texas Intermediate (WTI) futures surged nearly 3%, pushing prices close to $72 per barrel. This sharp increase in oil prices reflects market fears of supply constraints as the conflict in the Middle East escalates. Given Iran’s role as a major oil producer, accounting for about 5% of the world’s total output, any prolonged conflict could have significant ramifications for the global energy market.
Investors have responded to these concerns by flocking to energy stocks, with Chevron’s stock gaining 1.6% in premarket trading. Chevron’s rise is also supported by its recent $53 billion acquisition of Hess (HES), which positions the company for long-term growth in the energy sector. The acquisition further strengthens Chevron’s portfolio by expanding its presence in key oil-producing regions, such as the prolific Guyana oil fields, adding to its already robust operations.
Despite the surge in oil prices, Chevron (NYSE: NYSE:CVX ) is also benefitting from strong market fundamentals. The company’s strong year-to-date performance is reflected in its 20% gain, showcasing investor confidence in the long-term viability of energy stocks amid ongoing geopolitical challenges. Analysts have pointed to Chevron’s disciplined capital spending, robust cash flow, and strategic acquisitions as factors bolstering its resilience during volatile market conditions.
Technical Analysis
From a technical perspective, Chevron’s stock is showing positive momentum. As of Wednesday, NYSE:CVX is up 0.71%, with shares trading above the 50-day moving average, signaling strength in the current uptrend. The stock’s relative strength index (RSI) currently sits at 62.21, approaching the overbought region, indicating strong buying pressure. Investors should closely monitor the RSI, as a move above 70 could signal overbought conditions, possibly leading to a short-term correction.
Chevron (NYSE: NYSE:CVX ) has been trading in line with the broader energy sector, benefiting from rising oil prices. The stock is following a bullish pattern, breaking above key resistance levels and trading near recent highs. The 50-day moving average (MA) provides critical support, indicating that Chevron's bullish momentum is likely to persist unless a significant downside event occurs.
Investors looking to capitalize on the stock’s strong uptrend should keep an eye on Chevron’s RSI and other momentum indicators, as the current trajectory suggests continued strength in the energy sector.
Geopolitical Uncertainty Driving Oil Prices
The ongoing conflict in the Middle East, especially Iran's involvement, has introduced heightened volatility to the energy market. The potential for broader conflict in the region raises the risk of supply disruptions, further fueling upward pressure on oil prices. UBS Global Wealth Management’s CIO Mark Haefele noted that positions in oil could act as a portfolio hedge against a worsening crisis in the Middle East, making energy stocks like Chevron an attractive option for risk-averse investors.
Moreover, while the firm’s base case is not for an all-out war, the potential for sustained tensions could continue to impact oil prices, benefitting energy stocks. Investors should also consider the broader market implications, including the potential for higher inflation driven by rising energy costs.
Conclusion
While Chevron’s stock may experience fluctuations in the near term, the overall outlook for the energy sector remains strong, supported by both technical and fundamental factors. As global energy markets brace for further volatility, Chevron is well-positioned to navigate the challenges ahead and deliver long-term value to its shareholders.

CVX Still in the Greer BuyZone (CVX #27 in USA by MarketCap)I'm tracking the top 100 USA companies by Market Cap.
And I just started using The Greer BuyZone tool to start to alert when one of these companies enter into the BuyZone.
Looking at CVX it is still in the BuyZone
Let's track it and see if this pays off?
If you are interested in tracking this with me let me know.
companiesmarketcap.com
#37 Market Cap World wide

Chevron May Be OverboughtEnergy stocks bounced last week. However they remain the worst-performing sector this year and now some traders may see downside risk in Chevron.
The first pattern on today’s chart is the March low of $147.67. CVX knifed through this potential support level in early August and peaked near it a few weeks later. Now it’s stalling around the same level. Has old support become new resistance?
Second, a peak here would represent a lower high versus late August. The stock also made a lower low in mid-September versus mid-August. Lower highs and lower lows are potentially consistent with downtrends.
Third, the 50-day simple moving average (SMA) had a “death cross” below the 200-day SMA last month.
Finally, stochastics have reached an overbought condition.
TradeStation has, for decades, advanced the trading industry, providing access to stocks, options and futures. See our Overview for more.
Past performance, whether actual or indicated by historical tests of strategies, is no guarantee of future performance or success. There is a possibility that you may sustain a loss equal to or greater than your entire investment regardless of which asset class you trade (equities, options or futures); therefore, you should not invest or risk money that you cannot afford to lose. Online trading is not suitable for all investors. View the document titled Characteristics and Risks of Standardized Options at www.TradeStation.com . Before trading any asset class, customers must read the relevant risk disclosure statements on www.TradeStation.com . System access and trade placement and execution may be delayed or fail due to market volatility and volume, quote delays, system and software errors, Internet traffic, outages and other factors.
Securities and futures trading is offered to self-directed customers by TradeStation Securities, Inc., a broker-dealer registered with the Securities and Exchange Commission and a futures commission merchant licensed with the Commodity Futures Trading Commission). TradeStation Securities is a member of the Financial Industry Regulatory Authority, the National Futures Association, and a number of exchanges.
TradeStation Securities, Inc. and TradeStation Technologies, Inc. are each wholly owned subsidiaries of TradeStation Group, Inc., both operating, and providing products and services, under the TradeStation brand and trademark. When applying for, or purchasing, accounts, subscriptions, products and services, it is important that you know which company you will be dealing with. Visit www.TradeStation.com for further important information explaining what this means.


Comprehensive Analysis of Chevron (CVX) - 16/09/2024Chevron (CVX) is an established energy company listed in the S&P 500 index.
Technical Analysis: I use moving averages as zones rather than lines. On the weekly chart, I applied the 200 EMA and 200 SMA, shading the area between them in orange to create a moving average zone. Currently, prices are finding support in this zone on the weekly chart.
Additionally, the $140 level acts as a demand zone and creates confluence.
On the daily chart, the ATR-based Keltner Channels are touching the lower band, indicating that downside volatility has reached its natural limits. There is also a bullish order block present.
On the 4-hour chart, I use the Inverse Fisher RSI. It filters out noise and provides fewer false signals compared to the standard RSI.
On the 1-hour chart, there is a noticeable decline in volume. Remember, without volume, it is difficult to break through support or resistance levels. From a technical standpoint, different timeframes are giving BUY signals.
Fundamental Analysis: The company has a price-to-earnings ratio of 13.81, which is considered normal for the sector. In the last quarter, Chevron reported total revenue of $49.66 billion and a net profit of $4.43 billion, resulting in a 9% profit margin, which meets my no-loss rule.
Chevron has strong return on equity, and growth continues. Its current ratio is 1.16, meaning its short-term assets exceed its liabilities, indicating financial stability.
The price-to-book ratio is 1.60, which is excellent for a company of this size.
Chevron's total assets stand at $260 billion, while total liabilities are around $100 billion, meaning the company's debt-to-assets ratio is 38.51%, which is highly acceptable.
The company’s annual dividend yield is 4.55%, providing a potential bonus for long-term investors.
With CVX trading near its 52-week low and showing positive signals, it could be a good choice for portfolio managers.

CVX - 1W - Symmetrical Triangle BreakdownChevron has broken down from a symmetrical triangle that started in July 2022, along with its 200-day EMA.
The outlook appears bearish, with a price target around USD100.
