CVX = Long Set-Up I'm bullish on WTI and the energy sector in general at this level.
I like Chevron which is close to my buy point for a fifth wave to new highs.
Chart pretty much says it all. Wait for it. It needs to find at bottom at the confluence of trendlines on the chart.
I'll update as needed in the near future
CVX trade ideas

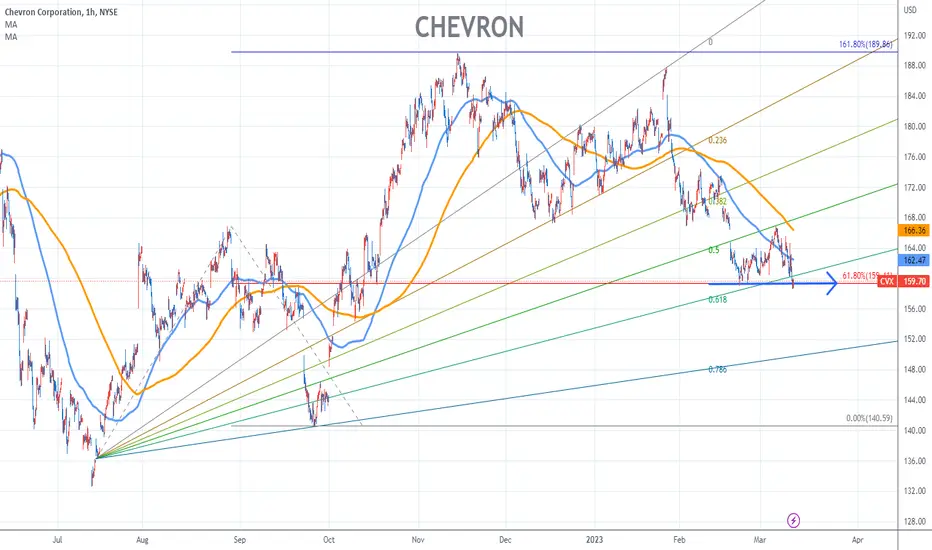
CHEVRON Stock Chart Fibonacci Analysis 032823Trading Idea
1) Find a FIBO slingshot
2) Check FIBO 61.80% level
3) Entry Point > 158/61.80%

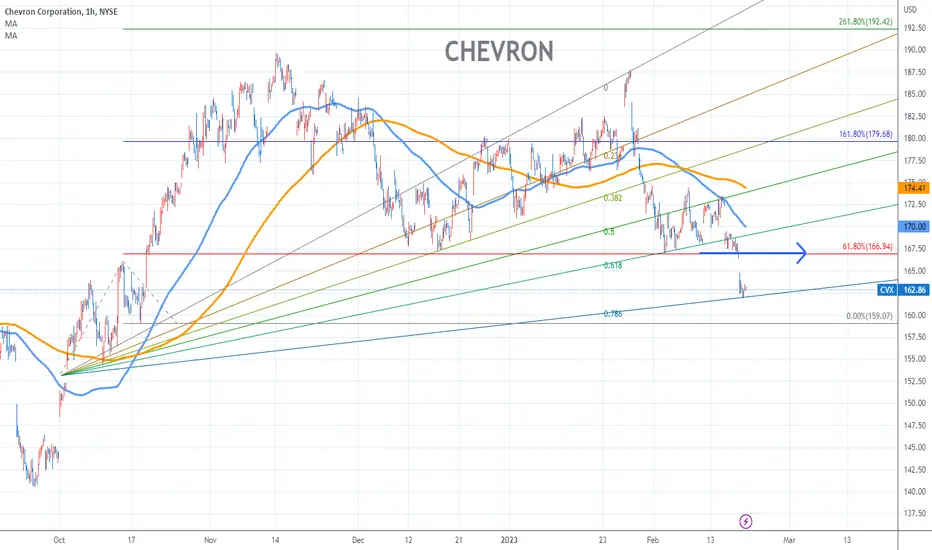
CHEVRON Stock Chart Fibonacci Analysis 031123 1) Find a FIBO Slingshot
2) Check FIBO 61.80% level
3) Entry Point > 160/61.80%

CVX bouncing at resistance level, just a posibility $CVXCVX is right now at an important support level, with the WTS reaching the oversold zone. In my opinion, price bouncing is really appealing with the market bottom indicator in green. I would like to wait a bit to look if the price breaks the support and return or if it breaks it definitely.
Let's see.

EW analysis - CVX gathering new strength or loosing steam?In the short run we will probably see rising prices in the gas and oil markets.
Can energy companies like Chevron benefit from that expected movement?
It is not easy to tell. This year so far the performance was quite meager.
But in the near future we should see an upward move in CVX.
The only question is, whether it is a final move without much steam or the beginning of a large wave 5 that could lead to a DOUBLING of prices.
At the moment I prefer the second interpretation. Then would we have seen is a double 1 - 2 as illustrated in the chart.
The alternative would be an expanding ending diagonal as illustrated in the chart below. In both cases we should soon see a move to the upside. But in the case of an ending diagonal the gains would be capped somewhere between 210 an 220 USD.
At the moment I favor the first interpretation (double 1 - 2).
Pros:
Both upward moves look impulsive they can be counted as five waves
I expect the general market as represented by the S & P 500 to appreciate big time
Energy prices will climb in the near time
Wave 5 in a commodity related stock often expands and is the largest wave
Cons:
CVX profited from high energy prices due to the Russian-Ukrainien war last year
Green energy an ESG could become a problem for CVX
Higher energy prices will not be sustainable in the long run
An ending diagonal in a commodity related stock is rare.

CHEVRON Stock Chart Fibonacci Analysis 021923Trading Idea
1) Find a FIBO slingshot
2) Check FIBO 61.80% level
3) Entry Point > 167/61.80%
$CVX: Buy the dip...I think this is a low risk in energy here, I specially like $CVX due to the reward to risk ratio and general fundamentals and long term chart variables at play.
Best of luck!
Ivan Labrie.

CVX Chevron Corporation Options Ahead of Earnings If you haven`t bought CVX Chevron Corporation here:
Then looking at the CVX Chevron Corporation options chain ahead of earnings , I would buy the $180 strike price Puts with
2023-1-27 expiration date for about
$2.47 premium.
If the options turn out to be profitable Before the earnings release, i would sell at least 50%.
Looking forward to read your opinion about it.

Weekly S&P500 Sector ReviewDiscussing all the leading sectors and stocks to identify major trends.
This weekly timeframe is suitable for longer term investors but insightful for traders.

Chevon $CVX could come back strongly & surprise short traders 🚨This is energy play at a low risk area. The sector has been beaten down severely for weeks and I am expecting a turnaround soon for CVX to make another ALT that could surprise many experienced traders who are shorting the energy industries now.

$CVX with a Bearish outlook following its earnings #Stocks The PEAD projected a Bearish outlook for $CVX after a Negative Under reaction following its earnings release placing the stock in drift D with an expected accuracy of 85.71%.

Red flag for ChevronRed flag for Chevron $CVX
Announced big share buyback plans during earnings, shares popped higher from mini base but quickly reversed lower.
Chevron | Short the TopChevron looks like it is about to rollover after creating a new high, along with announcing a buy-back program.
Not really much else to say....? bye ✌️

CVX - Horizontal (Resistance Turned Support)In each horizontal example the initial push is seen as great resistance, but it is pushed through and this horizontal is eventually seen as support eventually, from this support price continues to rise (as seen in first example)
Bullish potential

CVXThe Trend Lines are above. If SPX does not decline, all the stocks can start a rally which I expect cannot exceed the ATH. I expect 2024 will be the bigger rally and this year, I expect fluctuations.
Not an investment reccomendation.

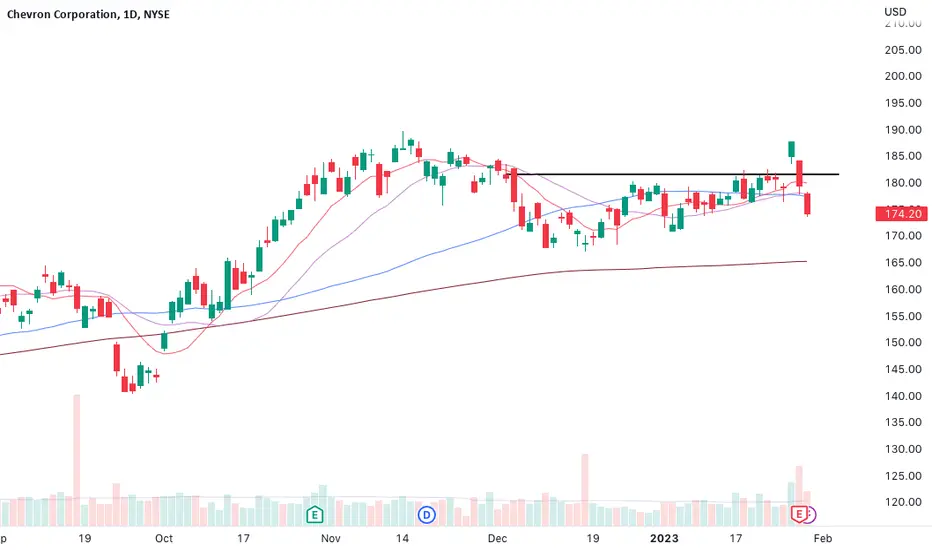
Potential Bullish Triangle in ChevronEnergy stocks have been holding their gains of the last two years following a pullback in early December. Now one of the biggest names could have signs of resuming its uptrend: Chevron
The first pattern on today’s chart is the series of higher lows since December 16. CVX probed the December 27 close near $177.50 several times during this period. The result has been an ascending triangle -- a potential bullish continuation pattern.
Next, prices are back above the 50-day simple moving average (SMA). That may indicate buyers are taking control over the intermediate term.
Third, you have some short-term signals: MACD is rising and the 8-day exponential moving average (EMA) has crossed back above the 21-day EMA.
TradeStation has, for decades, advanced the trading industry, providing access to stocks, options, futures and cryptocurrencies. See our Overview for more.
Important Information
TradeStation Securities, Inc., TradeStation Crypto, Inc., and TradeStation Technologies, Inc. are each wholly owned subsidiaries of TradeStation Group, Inc., all operating, and providing products and services, under the TradeStation brand and trademark. TradeStation Crypto, Inc. offers to self-directed investors and traders cryptocurrency brokerage services. It is neither licensed with the SEC or the CFTC nor is it a Member of NFA. When applying for, or purchasing, accounts, subscriptions, products, and services, it is important that you know which company you will be dealing with. Please click here for further important information explaining what this means.
This content is for informational and educational purposes only. This is not a recommendation regarding any investment or investment strategy. Any opinions expressed herein are those of the author and do not represent the views or opinions of TradeStation or any of its affiliates.
Investing involves risks. Past performance, whether actual or indicated by historical tests of strategies, is no guarantee of future performance or success. There is a possibility that you may sustain a loss equal to or greater than your entire investment regardless of which asset class you trade (equities, options, futures, or digital assets); therefore, you should not invest or risk money that you cannot afford to lose. Before trading any asset class, first read the relevant risk disclosure statements on the Important Documents page, found here: www.tradestation.com .

Oil and Oil Company Divergence to End Soon
Either the oil companies will dump or oil will rise sharply such that Oil companies and Oil get back in sync. The divergence started in mid 2022 and has been quite perplexing and I don't have a good hypothesis as to why (war could have something to do with it). However, they have always sought each other out in the long run and while there is some chance that oil companies will fall (red (c)), I think Oil will do the work and start a sharp increase as soon as it bottoms here shortly. Any other insights?

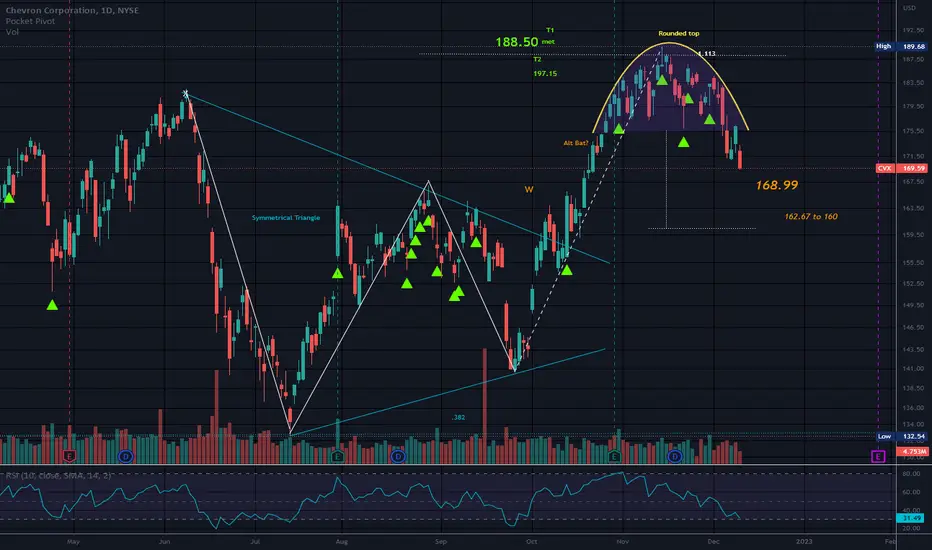
FlagThe pole is up so it is a bull flag I suppose.
Price is barely over the resistance line of the structure so I turned the line blue versus red. I would not call it a clean break or an uptrend over the flag R line, Some would adhere to 2 closes over the R line unless it is a huge green candle. It is really what you are comfortable with.
Suspicious W but oil seems to defy the odds, but I would still do a second look if price reaches the 1.113.
167.10 appears to be a strong level of support and also lines up with C in an ABC pattern.
There are rising wedges well below price, but these are not valid until price reaches down to the area of over-supply. The over-supply dwelling in the rising wedge will kick in as a rule when the level is met. The lower line of a Rising Wedge is a level of support and is why this pattern is not valid until this line is broken.
The lowest wedge I spot for CVX is around 115ish but we are not there.
No recommendation.
EL is 182.75/Earnings are 1-27-23

Chevron Corp (CVX.US) Big ShortAnother tread from the Big Sort US series. Throughout 2023, I expect total shorts on US stock markets.

$CVX with the 2-2-2u continuation on the day approaching 5EMA$CVX with the 2-2-2u continuation on the daily approaching the 50EMA at the $173.50 PL,in route to the $174.92 PL
NYSE:CVX

CHEVRON The road to recovery is set but will have its bumpsThe Chevron Corporation (CVX) has been pulling back since the November 15 rejection and is already below the 1D MA50 (blue trend-line) headed towards the 1D MA200 (orange trend-line).
As you see the stock has been trading on a Fibonacci Channel since the October 29 2020 bottom and its last two Higher Lows (July 14, September 28) found Support on or around the 1W MA50 (red trend-line).
Remarkably, we last saw the very same Fibonacci Channel during the 2010/11/12 period (chart on the right). The RSI sequences on the 1W time-frame of the two periods are identical and it appears that we are currently headed for the Higher Low (green circle on the RSI) before testing the overhead Resistance Zone (red).
If the 2010/11/12 sequence continues to get repeated, then we should expect another two Resistance rejections and pull-backs before we convincingly break to a significantly Higher High.
That pattern shows that Chevron is in recovery mode already but the road will has its bumps along the way but we can take advantage of them by buying low and selling high.
-------------------------------------------------------------------------------
** Please LIKE 👍, SUBSCRIBE ✅, SHARE 🙌 and COMMENT ✍ if you enjoy this idea! Also share your ideas and charts in the comments section below! This is best way to keep it relevant, support me, keep the content here free and allow the idea to reach as many people as possible. **
-------------------------------------------------------------------------------
You may also TELL ME 🙋♀️🙋♂️ in the comments section which symbol you want me to analyze next and on which time-frame. The one with the most posts will be published tomorrow! 👏🎁
-------------------------------------------------------------------------------
💸💸💸💸💸💸
👇 👇 👇 👇 👇 👇

Rounded Top/XOM is a BuddyThis pattern can indicate a pullback and in some cases a reversal.
There are rising wedges below price on hourly and daily that have not been broken so these patterns are not valid.
One of the wedges can take this below 112 but it is not valid at this time.
Most oil stocks are well above rising wedges in their charts but oil moves together as a rule so even those who have no wedges, like DVN, will fall when this group falls.
Who knows? Not me.
No recommendation