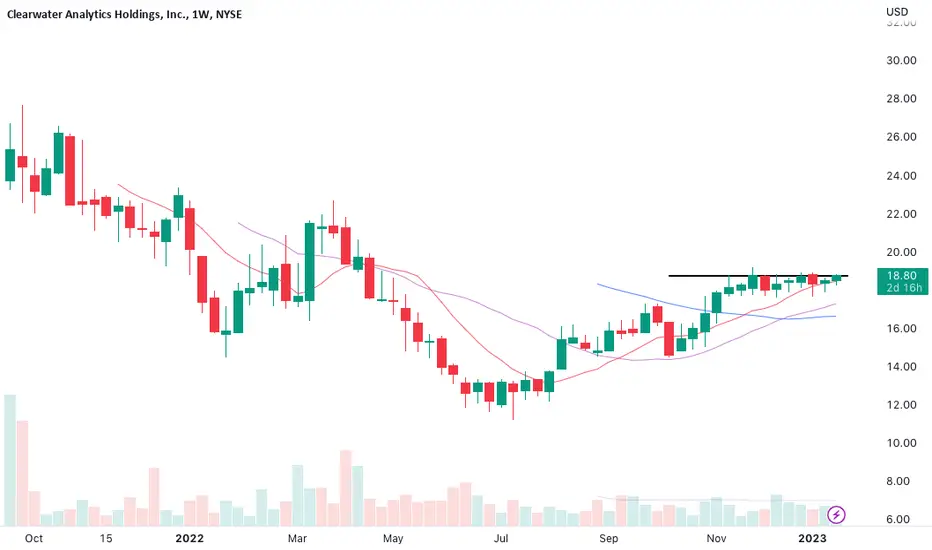
$CWAN, Long, TP>15-20%NYSE:CWAN , Long, TP>15-20%
Fundamentally the stock is good.
Choose an entry point and do not forget about a protective order if you are trading with leverage.
Don't risk it if you're not sure.
Good luck to everyone.
Next report date
—
Report period
—
EPS estimate
—
Revenue estimate
—
1.89 USD
424.38 M USD
451.80 M USD
238.19 M
About Clearwater Analytics Holdings, Inc.
Sector
Industry
CEO
Sandeep Sahai
Website
Headquarters
Boise
Founded
2004
FIGI
BBG012C765L4
Clearwater Analytics Holdings, Inc. engages in the provision of web-based investment portfolio accounting, reporting, and reconciliation services. It operates through the United States and Rest of World geographical segments. Its products include automated data aggregation and validation, investment accounting, integrated reporting tools, a user-friendly solution, and business-specific tools. The company was founded in 2004 and is headquartered in Boise, ID.
Related stocks

$CWAN Ready to Break Out of The Flat Base?
NYSE:CWAN is a name most of us have never heard of. They serve hedge funds, asset managers, and insurance clients with Analytic software.
It looks like it is in the process of putting in a higher low. It has regained the 8 and 20 EMAs and the MACD has turned positive. It can still go either way.

Clearwater Analytics, volatility contration before breakoutClearwater Analytics provides SaaS solutions for investment data aggregation, accounting, analytics, and reporting services
The 3-month highs and 6-month highs list is full of financials with some software, and NYSE:CWAN is making 52-week highs
Is the #1 in the IBD industry rank with a 91 relati

$CWAN$CWAN - young stock (recently IPO-ed). Tightened up for close to 2.5 months. Looks ripe to breakout higher.
$CWAN Very Early Turn$CWAN relatively recent IPO that broke its weekly down trend and been moving sideways since then.
RS like made four days in a row 3 months NHBP.
Price tighting up with volatilely max contraction on.
200 MA just now flattening. So very very early turn.

LONG CWAN reasonable companyI like the company the do good thing with company i believe that in the future the price of this asset will increase

$CWAN is giving a GREAT IPO LONG opportunity todayIPO intraday trading strategy idea
The share price is rising and gonna continue this trend today.
The demand for shares of the company still looks higher than the supply.
These and other conditions can cause a rise in the share price today.
So I opened a long position from $24,00;
stop-loss — $2

See all ideas
Summarizing what the indicators are suggesting.
Neutral
SellBuy
Strong sellStrong buy
Strong sellSellNeutralBuyStrong buy
Neutral
SellBuy
Strong sellStrong buy
Strong sellSellNeutralBuyStrong buy
Neutral
SellBuy
Strong sellStrong buy
Strong sellSellNeutralBuyStrong buy
An aggregate view of professional's ratings.
Neutral
SellBuy
Strong sellStrong buy
Strong sellSellNeutralBuyStrong buy
Neutral
SellBuy
Strong sellStrong buy
Strong sellSellNeutralBuyStrong buy
Neutral
SellBuy
Strong sellStrong buy
Strong sellSellNeutralBuyStrong buy
Displays a symbol's price movements over previous years to identify recurring trends.
Frequently Asked Questions
The current price of CWAN is 21.32 USD — it has increased by 0.90% in the past 24 hours. Watch Clearwater Analytics Holdings, Inc. stock price performance more closely on the chart.
Depending on the exchange, the stock ticker may vary. For instance, on NYSE exchange Clearwater Analytics Holdings, Inc. stocks are traded under the ticker CWAN.
CWAN stock has fallen by −2.25% compared to the previous week, the month change is a −5.12% fall, over the last year Clearwater Analytics Holdings, Inc. has showed a 4.56% increase.
We've gathered analysts' opinions on Clearwater Analytics Holdings, Inc. future price: according to them, CWAN price has a max estimate of 36.00 USD and a min estimate of 26.00 USD. Watch CWAN chart and read a more detailed Clearwater Analytics Holdings, Inc. stock forecast: see what analysts think of Clearwater Analytics Holdings, Inc. and suggest that you do with its stocks.
CWAN reached its all-time high on Nov 7, 2024 with the price of 35.71 USD, and its all-time low was 11.23 USD and was reached on Jul 13, 2022. View more price dynamics on CWAN chart.
See other stocks reaching their highest and lowest prices.
See other stocks reaching their highest and lowest prices.
CWAN stock is 2.71% volatile and has beta coefficient of 0.91. Track Clearwater Analytics Holdings, Inc. stock price on the chart and check out the list of the most volatile stocks — is Clearwater Analytics Holdings, Inc. there?
Today Clearwater Analytics Holdings, Inc. has the market capitalization of 5.77 B, it has decreased by −0.22% over the last week.
Yes, you can track Clearwater Analytics Holdings, Inc. financials in yearly and quarterly reports right on TradingView.
Clearwater Analytics Holdings, Inc. is going to release the next earnings report on Aug 6, 2025. Keep track of upcoming events with our Earnings Calendar.
CWAN earnings for the last quarter are 0.13 USD per share, whereas the estimation was 0.12 USD resulting in a 4.98% surprise. The estimated earnings for the next quarter are 0.11 USD per share. See more details about Clearwater Analytics Holdings, Inc. earnings.
Clearwater Analytics Holdings, Inc. revenue for the last quarter amounts to 126.86 M USD, despite the estimated figure of 125.08 M USD. In the next quarter, revenue is expected to reach 174.13 M USD.
CWAN net income for the last quarter is 6.51 M USD, while the quarter before that showed 419.49 M USD of net income which accounts for −98.45% change. Track more Clearwater Analytics Holdings, Inc. financial stats to get the full picture.
No, CWAN doesn't pay any dividends to its shareholders. But don't worry, we've prepared a list of high-dividend stocks for you.
As of Jul 27, 2025, the company has 1.92 K employees. See our rating of the largest employees — is Clearwater Analytics Holdings, Inc. on this list?
EBITDA measures a company's operating performance, its growth signifies an improvement in the efficiency of a company. Clearwater Analytics Holdings, Inc. EBITDA is 47.05 M USD, and current EBITDA margin is 7.24%. See more stats in Clearwater Analytics Holdings, Inc. financial statements.
Like other stocks, CWAN shares are traded on stock exchanges, e.g. Nasdaq, Nyse, Euronext, and the easiest way to buy them is through an online stock broker. To do this, you need to open an account and follow a broker's procedures, then start trading. You can trade Clearwater Analytics Holdings, Inc. stock right from TradingView charts — choose your broker and connect to your account.
Investing in stocks requires a comprehensive research: you should carefully study all the available data, e.g. company's financials, related news, and its technical analysis. So Clearwater Analytics Holdings, Inc. technincal analysis shows the sell today, and its 1 week rating is sell. Since market conditions are prone to changes, it's worth looking a bit further into the future — according to the 1 month rating Clearwater Analytics Holdings, Inc. stock shows the sell signal. See more of Clearwater Analytics Holdings, Inc. technicals for a more comprehensive analysis.
If you're still not sure, try looking for inspiration in our curated watchlists.
If you're still not sure, try looking for inspiration in our curated watchlists.