DNA on WatchLooking to by a pullback to previous high of day, just above $9.
Why:
Strong close today with high volume
Low volume on the previous pullback from June 11 to June 20
Looking for a retest of previous high ~$10
DNA trade ideas

2/21/25 - DNA: new SELL mechanical trading signal.2/21/25 - DNA: new SELL signal chosen by a rules based, mechanical trading system.
DNA - SELL SHORT
Stop Loss @ 16.36
Entry SELL SHORT @ 10.82
Target Profit @ 6.98
Analysis:
Higher timeframe: Prices have stayed below the upper channel line of the ATR (Average True Range) Keltner Channel and reversed.
Higher timeframe: Victor Sperandeo's (Trader Vic) classic 1-2-3 SELL pattern...where the current highest top breakout price is less than the preceding top price.
Higher timeframe: Price peaked above the ATR (Average True Range) breakout high and then reversed.
Ginkgo Bioworks (DNA) - Breakout or Breakdown?📊 Technical Overview:
DNA stock is currently trading inside a well-defined ascending channel, bouncing between support and resistance levels. After a sharp pullback, the price is now testing a critical support zone around $12.50-$12.70 – a key decision point for traders.
🔍 Key Technicals:
✔ Strong Uptrend: Despite the recent drop (-7.92%), the stock remains within its bullish channel.
✔ Support Retest: Holding above $12.50 could trigger a strong bounce toward the upper channel at $17.19.
✔ ADX Strength: ADX at 31.98 indicates a strong trend—momentum is here, but will the bulls step in?
✔ Stoch RSI Oversold: Currently at 24.49, hinting at a potential reversal opportunity.
🚨 Trading Plan:
📌 Bullish Scenario: If support at $12.50 holds, expect a rebound towards $17.19 (next resistance level).
📌 Bearish Scenario: A breakdown below $12.50 could push the stock lower to $11.00 before finding new buyers.
🔥 Risk-Reward Ratio in Favor of Bulls! With a stop-loss near $11 and a target at $17.19, this setup presents an attractive risk/reward opportunity for traders looking to capitalize on a potential breakout.
💬 What’s your move? Are you buying the dip or waiting for confirmation? Drop your thoughts below! 🚀📈

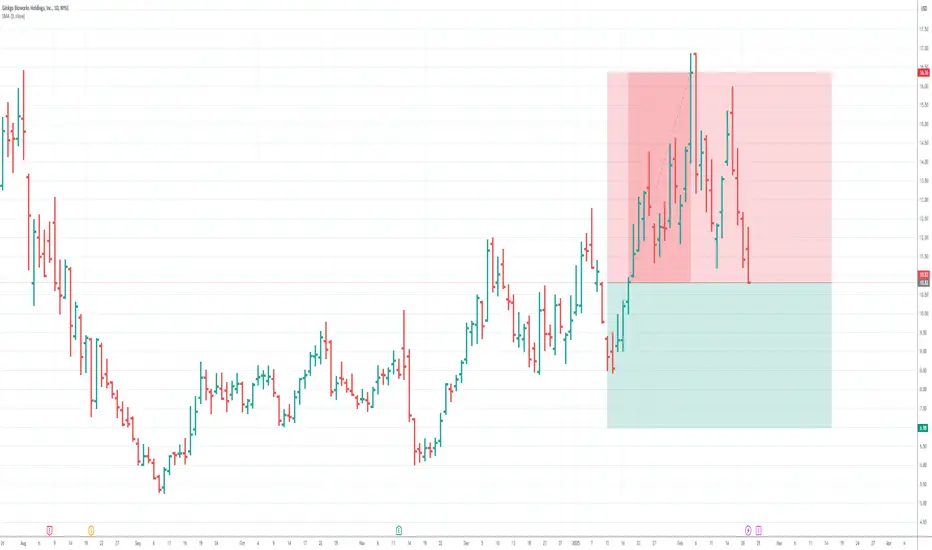
DNA: smooth seas aheadAfter an atrocious multi-year sell-off, DNA is building support above $10-11. Strong financial results and outlook could threaten to fill the gap back up to $30 over the next few months. The previous sell-off shows very few sign of resistance in this range ($11-$30). Watch out bears.

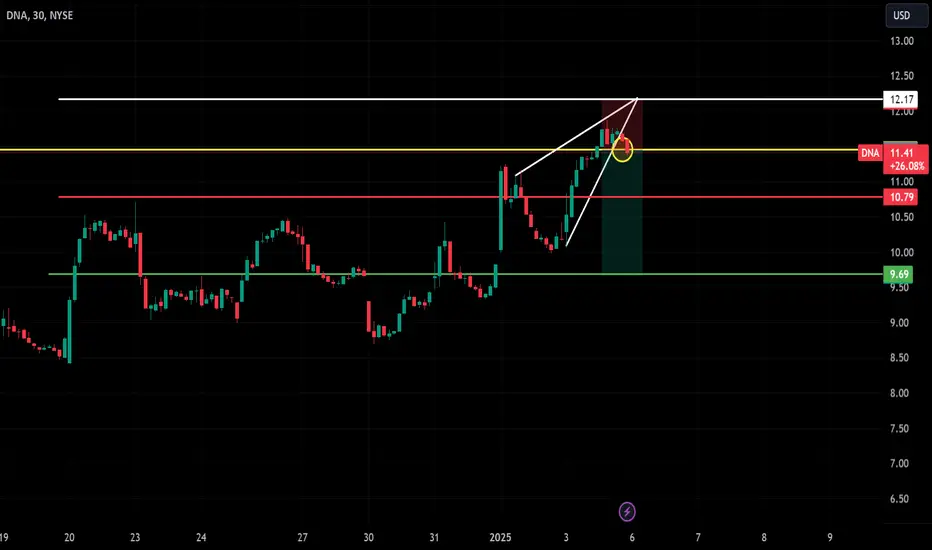
DNA Short Trade Setup (30-Min Chart) ! 📉
- Entry:** $11.40
- Target 1 (T1):$10.79 🟢
- Target 2 (T2): $9.69 🟢
- Stop Loss: $12.17 🔴
Summary: Short trade targeting $10.79 (T1) for quick gains and $9.69 (T2) for extended profit, with risk managed by a stop loss at $12.17. 📉🚨
@gabbi3929 @AbdulMAnsari
DNA: Triangle Breakout Setup with Key Levels!DNA is forming a triangle pattern on the 30-minute chart, signaling potential breakout opportunities. Entry at $11.09 with a stop-loss at $10.58. Profit targets are set at $11.67 and $12.38. Watch for a decisive move to confirm direction and apply proper risk management!

Trade Review - DNA
When this stock was added to the watchlist, it displayed a bullish continuation setup on the daily timeframe. On the higher timeframe, there was also a potential for downside overextension, suggesting a possible pullback within the larger downtrend.
On the next chart, executions are shown. In anticipation of the trade, I look for a failed breakout against the trend—a failure test—where the price moves outside the lower boundary of an established consolidation. If it then closes back within the range, I sometimes enter before market close. For these trades, I often close a partial position as the price nears the upper part of the range, in case the range holds without a breakout.
Trade Overview
• Structure: Bullish Continuation (D) / Bearish Pullback (W)
• Position: Near Mean (D) / Extended from Mean (W)
• Entry Trigger: Failed Breakout (Opposite to Trend)
Entry Details
• Entry Price: 7.77
• Stop Price: 6.73
• Target Price (Range): 8.72
• Target Price (Measured Move): 11.62
Exit Strategy
• Exit Price: Closed 50% into 9.03 > Rest hit SL at 7.95.

DNA Ginkgo Bioworks Holdings Options Ahead of EarningsAnalyzing the options chain and the chart patterns of DNA Ginkgo Bioworks Holdings prior to the earnings report this week,
I would consider purchasing the 0.50usd strike price Calls with
an expiration date of 2024-12-20,
for a premium of approximately $0.08.
If these options prove to be profitable prior to the earnings release, I would sell at least half of them.

DNA do not touch this!The stock is at absolute lows, in stark contrast to the sector indices, which are not at these levels. This relative weakness suggests extreme caution regarding the stock. It will be necessary to wait for some confirmation, such as signs of strength and interest from buyers, BEFORE considering any bullish positions.
We are in the area of the lower parallel of a Median Line Pitchfork that has captured the bearish movement. At current prices, caution is necessary; prices are undoubtedly in oversold territory, but this does not mean a reaction is imminent. We reiterate: Clear reactions will require multiple confirmations.

DNA Ginkgo Bioworks Looking to complete EW bearish sequenceDNA had massive bearish selloff and is trading at very low price just above HKEX:1 area. Between current lows and ATH, we can anticipate a decent rally before resuming a larger move lower (if that would happen in future). At these lows its great price range to accumulate and build a position using risk management and DCA strategy. It's been trading back it forth between $1.15-1.40; approx 15-20% difference in gains. You can try trade it back it forth with focus on taking some profits to create a lower cost position and then using those profits to buy more shares. If you want to really play safe, aim to sell 50% at 2x (or 3x) and hold the remaining 50% balance of your DNA portfolio 100% risk free for life (e.i Buy 1000 shares at $1.20 to Sell 500 shares (50%) at $2.40). Just some strategies worth looking into.
As for the current wave count, favoring DNA to be possible ending its 5th and final wave down. Market-wide, things seem risky and tough to support the idea any assets would pump while indices dump. However many times, smaller cap assets tend to get some nice pumps, not always but often. Its a matter of risk to reward while applying a safe risk management strategy. Our goal is profits, small chucks along the way. SO the target zone here is within the pink lines (wave V ending calculation) of $1.26-$0.96 area with the fib extension calculation showing the 1.618 at $0.82 area. I dont see it going much lower than HKEX:1 at these lows, maybe after a rally but not here. I can be wrong too.
We shall see how it plays outs.
If you like my charts please smash like to show support, it would be appreciated and feel free to leave comments or ask questions.
Play safe & happy trading

Does $DNA has any change of bouncing ?It is true this has been on a down trend but could it be is time to break out? After the bad earnings I expected this to go to the bottom of the channel but it stopped at support and bounce. This is a long play but may be time to get in. After all Vanguard and ARK have been loading.

DNA long positionhi traders
We can see a potential double bottom pattern on the weekly time frame.
The price is still at the potential bottom and it's easy to strategize the trade here.
Entry, target, take profit and stop loss are shown on the chart.
If the key support fails, it would be an invalidation of the double bottom formation and the long positions should be closed.

Ginkgo Bioworks (DNA) should test Resistance line at 1.55Daily chart, the stock rebounded from the support line S, and should target the falling Resistance line R at around 2.55
Crossing resistance and trading above 2.55 for 2 days, the target will be 2.30 extending to 2.47
Technical indicator RSI is in the BUY area.

Great risk reward, but you have be patientPrice is consolidation in what it appears to be an ascending triangle. I think it needs some more work to do but I opened a long position bc you never know with penny stocks. They can just blow up in hours so I don't want miss it.

Nice entry zone $DNAPossible trend reversal. Strong support. Accumulation from the bottom range. Possible gartley in play. Even if the validity fails it works as a well indicator which decides my range.
Small TF downtrend possible to the 1.20 support untill breaking trend. I am still learning, open for feedback.
Regards!

$DNA - UpdateNYSE:DNA is losing steam and appears to be entering a breakdown. Waiting to enter until around $1.60 - $1.70.

DNA- A good buy entryDNA stocks has many good support to buy:
-Key level.
-Big demand zone.
-Quasimodo pattern.
-Less supply at the bottom.
.
Will update this case.

DNA Ginkgo Bioworks Holdings Options Ahead of EarningsIf you haven`t bought DNA here:
Then analyzing the options chain and the chart patterns of DNA Ginkgo Bioworks Holdings prior to the earnings report this week,
I would consider purchasing the $2.50 strike price Calls with
an expiration date of 2023-12-15,
for a premium of approximately $0.32.
If these options prove to be profitable prior to the earnings release, I would sell at least half of them.
Looking forward to read your opinion about it.

DNA bullsNYSE:DNA crazy move after google cooperation deal and close above 200 EMA after 0ne month of falling below it.
will buyers keep holding !!

$DNA - Head and ShouldersIn the coming weeks it looks like a Head and Shoulders will form. Looking to exit around $1.98 if this holds true and then re-enter along the $1.30s where strong support appears.

DNA Ginko Bioworks; be ready bio-world!NYSE:DNA be ready for bio-world, bio-factory, biological food ingredients via cell programming!
Advise yourself smartly!

$DNA Possible Accumulation. Fib levels very reactive.A pretty compelling argument for a classic Wyckoff Accumulation pattern. We know some people like Woods are investing heavily into this market, so it's not a long shot to assume there are others. Whether we see a spring or LPS our way up to SOS is TBD, we could shoot in either direction as it stands. PTs are at $7-$15 according to analysts. This seems to line up with extensions. OBV shows each consecutive low on the PA is higher on the OBV. This is a great indication of an increase of strong hands ownership. Overall, I think I am mostly bullish at the current level. Should we happen to dip lower for a spring, I will significantly add to my position.

Ginkgo BioTechPotentially longer term investment idea, showing signs of bottoming with bullish divergence on the 2D chart on the right
www.ginkgobioworks.com
