DQ correction for short term profit taking? I've been long on DQ since 140 and I feel like there's a strong chance of a short term price correction to resistance levels of around 200 in the next couple days. Momentum has been ridiculous, fueled mostly by hype, since their earnings are really nothing too special / worthy of their PE. I'm seeing strong bearish divergence on the daily RSI on today's high (see chart). Also, MACD is crossing below the signal on the lower timeframes (4h). I can see myself closing my position, and buying any dip that comes up. What worries me more in terms of medium-term prospects is their consistency in beating EPS estimates, coupled with the boatload of hype investors .Benjamin Graham points out how companies that have a record of beating EPS estimates get their prices dragged through the mud as soon as they falter in meeting those estimates, regardless of any change in intrinsic value. I'm not going to try to predict anything about their Q3, but if they can't keep up their record of beating EPS estimates, this quarter or in the next ones, you can probably expect a sharp pullback. Long term investors shouldn't be too concerned, and maybe buy the (potential) dip if they feel the intrinsic value is still there.
I don't want to seem too pessimistic about DQ, but analysts are getting super bullish on their estimates, raising Q4 EPS estimates by 50% in the last three months. Again, I think DQ is a great company, but I'm not sure these estimates are realistic.
DQ trade ideas

DQ 09252020 Premarket Daily trade ideaPrice has a spike in the daily 21 EMA and it rejected previous gap up, for that reason we are gonna looking for longs in 117,53 to be with the trend

GoNoGo Charts and traditional technical analysisLet’s look at this chart and see how we can use traditional technical analysis while the GoNoGo Charts highlight all that we need to know in terms of trend and momentum. The technical analysis we need to get a complete picture of the security’s price action is blended into the GoNoGo chart leaving the price action unobscured.
So what do we see? After a strong rise, price has consolidated sideways in a small channel.
Price has broken out of the consolidation area and the GoNoGo Charts has pinpointed a low risk entry on the break. (Green circle)
As price breaks out, the GoNoGo Oscillator has bounced off zero.
Traditional technical analysis would suggest a target that is the same distance from the break as the rally into the pattern.
If there is a pull back after this breakout, the upper bound of the channel should provide support, and we will look for support at the zero line for the Oscillator.
What are the GoNoGo Indicators?
The GoNoGo Trend indicator blends traditional trend concepts to color price action according to the strength of its trend. The colors range from *bright blue (strongly *bullish) to dark *purple (strongly *bearish)
The GoNoGo Oscillator blends traditional *momentum concepts to demonstrate the velocity of price action. The oscillator ranges from -6 (extremely *oversold) to +6 (extremely *overbought)


DQ LongI want to see a close above 37.47 and a test of that level to enter. Targeting 39.47 which is fib .786 level and then 44.50


DQ- Looking for box and wedge breakSeveral set ups on daily chart that I'm following for break out. Notes on chart for my thought process

DQ SHORT - Head and shouldersSHORT. Head and shoulders - bearish adx macd rsi. first resistance @200MA second target full HS pattern at @25


DQ: Good Earnings SurpriseYesterday's earnings report is a huge difference from the past 2 quarters and the last time this company had an earnings report like that, it was trading in the $30 price range. For this pattern though, the target price is $15.45.
thepatternsite.com

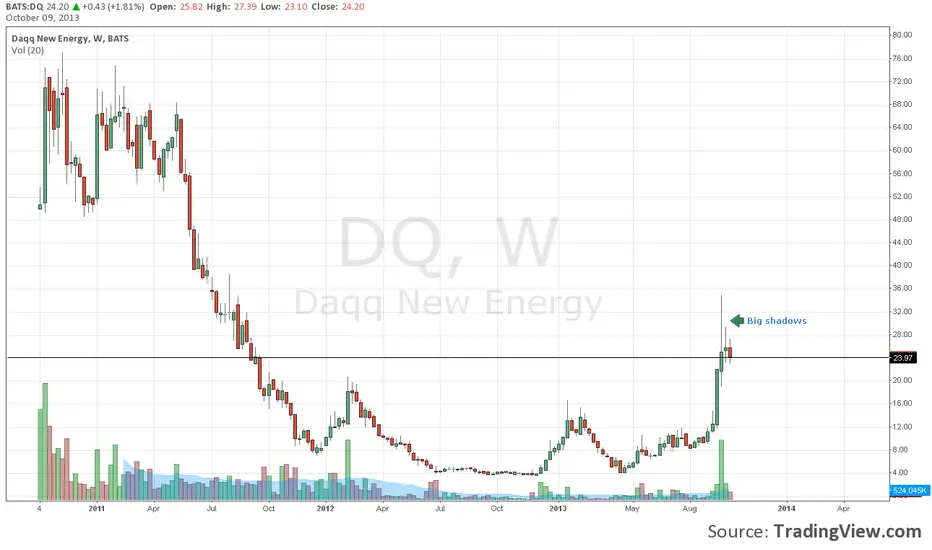
DQ'd...again.Below 24 might get a nice woosh down to 22. Could also bounce and squeeze shorts so extreme caution is required.