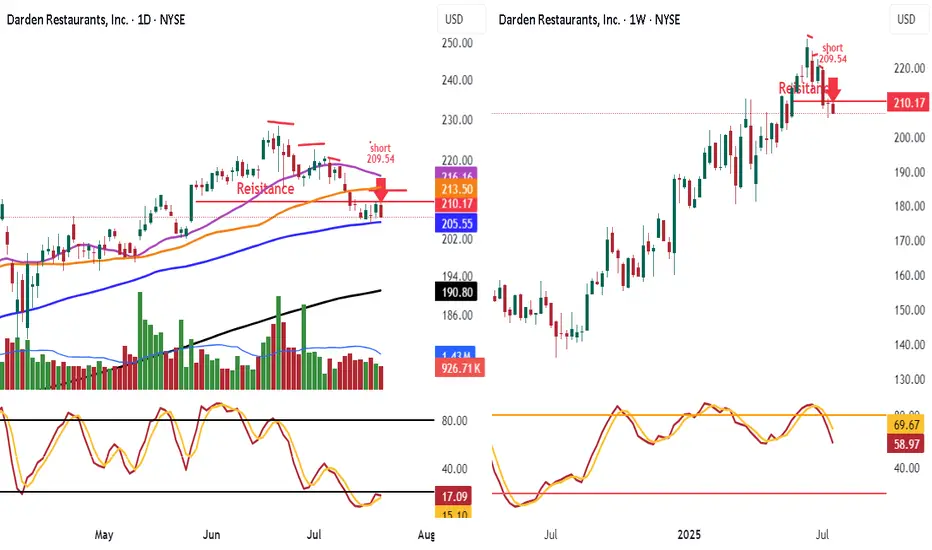
Shorted DRI 209.54 Look daily chart I shorted DRI going into resistance 210.17
look lower highs, Look all selling vol. Look at the 25 day ma rolling over heading to 50 day to cross thru, Look stoch heading down nice engulfing candle daily
Have order add breaks 100 day with vol 205.55
Look weekly stoch heading China
Next report date
—
Report period
—
EPS estimate
—
Revenue estimate
—
8.93 USD
1.05 B USD
12.08 B USD
116.72 M
About Darden Restaurants, Inc.
Sector
Industry
CEO
Ricardo Cardenas
Website
Headquarters
Orlando
Founded
1938
FIGI
BBG000BBNYF6
Darden Restaurants, Inc. is a full-service restaurant company, which engages in the provision of restaurant services. It operates through the following segments: Olive Garden, LongHorn Steakhouse, Fine Dining, and Other Business. The Olive Garden segment is the largest full-service dining Italian restaurant operator. The LongHorn Steakhouse segment includes the results of the company-owned LongHorn Steakhouse restaurants. The Fine Dining segment consists of the premium brands that operate within the fine-dining sub-segment of full-service dining and includes the results of its company-owned The Capital Grille and Eddie V's restaurants. The Other Business segment aggregates the remaining brands and includes the results of its company-owned Cheddar's Scratch Kitchen, Yard House, Seasons 52 and Bahama Breeze restaurants, and from franchises and consumer-packaged goods sales. The company was founded by William B. Darden in 1938 and is headquartered in Orlando, FL.
Related stocks
Markets Running Out SteamWatch the vol as we head into resistance
XLF IWM are weak. Still in earnings season
have stops in place

Darden Restaurants (DRI): Restaurant Industry Momentum ContinuesDarden Restaurants, Inc. (DRI) is one of the largest full-service restaurant companies, operating well-known brands like Olive Garden, LongHorn Steakhouse, and The Capital Grille. With a focus on quality dining experiences, strong brand recognition, and strategic expansion, Darden continues to grow

Darden May Have Broken OutDarden Restaurants jumped to new highs in December, and some traders may look for the move to continue this year.
The first pattern on today’s chart is the March 2024 high of $176.84. DRI remained below that level through early last month. The stock rallied through it after earnings and revenue bea

Puts/Short setup on DRI (Darden Restaurants)NYSE:DRI gapped Up on Dec 19th. Fibonacci technical analysis: Now finding Resistance at Fib level –61.8% (188.82) on Upward Fib and Double Top formed. Price likely to retrace lower to retest the gap.
My Downward Fib shows retracement levels 38.2 % at 171, 61.8% at 166.5, and 78.6% at 164.
PUT

$DRI with a bullish outlook following its earnings #StocksThe PEAD projected a bullish outlook for NYSE:DRI after a positive over reaction following its earnings release placing the stock in drift B with an expected accuracy of 88.89%.

$DRI | Channel BreakoutJust some notes im sharing. I do not know this stock well, but so far it is respecting projections.
Ideally we need a pullback to enter long

$DRI Bullish Pennant??NYSE:DRI looks to be bouncing off support around $144 and the highs of $175. Currently, it is turning up below value at the current moment. Currently above the 200-EMA

Darden Faces Dining Divide: Lower-Income Consumers Pull Back Darden Restaurants ( NYSE:DRI ), the parent company of popular chains like Olive Garden and LongHorn Steakhouse, is experiencing a shift in consumer behavior that reflects broader economic trends. While lower-income customers are cutting back on dining out, wealthier diners are showing an increased

Fast Food and Dining Stocks: Macro Fib SchematicsThese Fast Food Giants consist of McDonalds, Starbucks, YUM! Brands, Restaurant Brands Inc, Chipotle, Wendys, Darden Restaurants, Brinker International...
All Fibonacci Clusters are placed correctly. The 1 Month timeframe makes these charts realistic.

See all ideas
Summarizing what the indicators are suggesting.
Neutral
SellBuy
Strong sellStrong buy
Strong sellSellNeutralBuyStrong buy
Neutral
SellBuy
Strong sellStrong buy
Strong sellSellNeutralBuyStrong buy
Neutral
SellBuy
Strong sellStrong buy
Strong sellSellNeutralBuyStrong buy
An aggregate view of professional's ratings.
Neutral
SellBuy
Strong sellStrong buy
Strong sellSellNeutralBuyStrong buy
Neutral
SellBuy
Strong sellStrong buy
Strong sellSellNeutralBuyStrong buy
Neutral
SellBuy
Strong sellStrong buy
Strong sellSellNeutralBuyStrong buy
Displays a symbol's price movements over previous years to identify recurring trends.
DRI4597025
Darden Restaurants, Inc. 4.55% 15-FEB-2048Yield to maturity
6.77%
Maturity date
Feb 15, 2048
DRI.GH
Darden Restaurants, Inc. 6.8% 15-OCT-2037Yield to maturity
5.56%
Maturity date
Oct 15, 2037
DRI.GG
Darden Restaurants, Inc. 6.0% 15-AUG-2035Yield to maturity
5.42%
Maturity date
Aug 15, 2035
DRI5664374
Darden Restaurants, Inc. 6.3% 10-OCT-2033Yield to maturity
5.16%
Maturity date
Oct 10, 2033
DRI5906746
Darden Restaurants, Inc. 4.55% 15-OCT-2029Yield to maturity
4.67%
Maturity date
Oct 15, 2029
DRI4483798
Darden Restaurants, Inc. 3.85% 01-MAY-2027Yield to maturity
4.47%
Maturity date
May 1, 2027
DRI5906745
Darden Restaurants, Inc. 4.35% 15-OCT-2027Yield to maturity
4.37%
Maturity date
Oct 15, 2027
See all DRI bonds
Curated watchlists where DRI is featured.

Frequently Asked Questions
The current price of DRI is 204.48 USD — it has increased by 0.11% in the past 24 hours. Watch Darden Restaurants, Inc. stock price performance more closely on the chart.
Depending on the exchange, the stock ticker may vary. For instance, on NYSE exchange Darden Restaurants, Inc. stocks are traded under the ticker DRI.
DRI stock has fallen by −2.32% compared to the previous week, the month change is a −8.14% fall, over the last year Darden Restaurants, Inc. has showed a 46.43% increase.
We've gathered analysts' opinions on Darden Restaurants, Inc. future price: according to them, DRI price has a max estimate of 255.00 USD and a min estimate of 207.00 USD. Watch DRI chart and read a more detailed Darden Restaurants, Inc. stock forecast: see what analysts think of Darden Restaurants, Inc. and suggest that you do with its stocks.
DRI stock is 1.10% volatile and has beta coefficient of 0.46. Track Darden Restaurants, Inc. stock price on the chart and check out the list of the most volatile stocks — is Darden Restaurants, Inc. there?
Today Darden Restaurants, Inc. has the market capitalization of 23.93 B, it has decreased by −2.17% over the last week.
Yes, you can track Darden Restaurants, Inc. financials in yearly and quarterly reports right on TradingView.
Darden Restaurants, Inc. is going to release the next earnings report on Sep 18, 2025. Keep track of upcoming events with our Earnings Calendar.
DRI earnings for the last quarter are 2.98 USD per share, whereas the estimation was 2.97 USD resulting in a 0.46% surprise. The estimated earnings for the next quarter are 1.99 USD per share. See more details about Darden Restaurants, Inc. earnings.
Darden Restaurants, Inc. revenue for the last quarter amounts to 3.27 B USD, despite the estimated figure of 3.26 B USD. In the next quarter, revenue is expected to reach 3.03 B USD.
DRI net income for the last quarter is 303.80 M USD, while the quarter before that showed 323.40 M USD of net income which accounts for −6.06% change. Track more Darden Restaurants, Inc. financial stats to get the full picture.
Yes, DRI dividends are paid quarterly. The last dividend per share was 1.50 USD. As of today, Dividend Yield (TTM)% is 2.74%. Tracking Darden Restaurants, Inc. dividends might help you take more informed decisions.
Darden Restaurants, Inc. dividend yield was 2.74% in 2024, and payout ratio reached 63.17%. The year before the numbers were 3.55% and 61.60% correspondingly. See high-dividend stocks and find more opportunities for your portfolio.
As of Jul 26, 2025, the company has 197.92 K employees. See our rating of the largest employees — is Darden Restaurants, Inc. on this list?
EBITDA measures a company's operating performance, its growth signifies an improvement in the efficiency of a company. Darden Restaurants, Inc. EBITDA is 1.93 B USD, and current EBITDA margin is 16.34%. See more stats in Darden Restaurants, Inc. financial statements.
Like other stocks, DRI shares are traded on stock exchanges, e.g. Nasdaq, Nyse, Euronext, and the easiest way to buy them is through an online stock broker. To do this, you need to open an account and follow a broker's procedures, then start trading. You can trade Darden Restaurants, Inc. stock right from TradingView charts — choose your broker and connect to your account.
Investing in stocks requires a comprehensive research: you should carefully study all the available data, e.g. company's financials, related news, and its technical analysis. So Darden Restaurants, Inc. technincal analysis shows the sell today, and its 1 week rating is neutral. Since market conditions are prone to changes, it's worth looking a bit further into the future — according to the 1 month rating Darden Restaurants, Inc. stock shows the buy signal. See more of Darden Restaurants, Inc. technicals for a more comprehensive analysis.
If you're still not sure, try looking for inspiration in our curated watchlists.
If you're still not sure, try looking for inspiration in our curated watchlists.