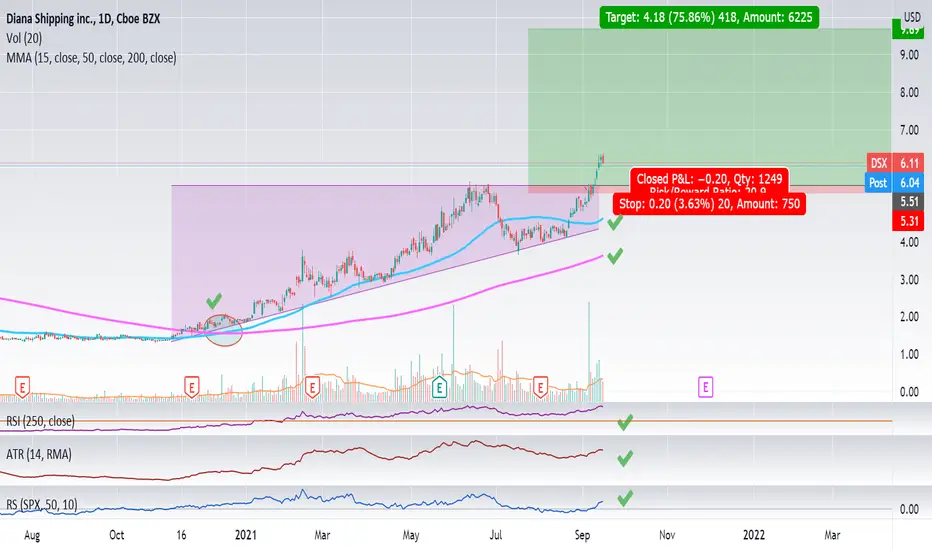
Annual outlook DSXIf you are into longer term plays, check this one out.
TPs based on forecast results.
We have a breakout with bull flag signaling continuation.
Heikin ashi setup agrees up.
Biggest concern is Z-Score resistance around 3.21 but as this accumulates it should push that target up.
Looking for 3.75 as the first target to look for.
Safe trades!
DSX trade ideas

DSX - 28 months HEAD & SHOULDERS══════════════════════════════
Since 2014, my markets approach is to spot
trading opportunities based solely on the
development of
CLASSICAL CHART PATTERNS
🤝Let’s learn and grow together 🤝
══════════════════════════════
Hello Traders ✌
After a careful consideration I came to the conclusion that:
- it is crucial to be quick in alerting you with all the opportunities I spot and often I don't post a good pattern because I don't have the opportunity to write down a proper didactical comment;
- since my parameters to identify a Classical Pattern and its scenario are very well defined, many of my comments were and would be redundant;
- the information that I think is important is very simple and can easily be understood just by looking at charts;
For these reasons and hoping to give you a better help, I decided to write comments only when something very specific or interesting shows up, otherwise all the information is shown on the chart.
Thank you all for your support
🔎🔎🔎 ALWAYS REMEMBER
"A pattern IS NOT a Pattern until the breakout is completed. Before that moment it is just a bunch of colorful candlesticks on a chart of your watchlist"
═════════════════════════════
⚠ DISCLAIMER ⚠
The content is The Art Of Charting's personal opinion and it is posted purely for educational purpose and therefore it must not be taken as a direct or indirect investing recommendations or advices. Any action taken upon these information is at your own risk.

Diana Shipping Bringing in the Goods. DSXWe are not in the business of getting every prediction right, no one ever does and that is not the aim of the game. The Fibonacci targets are highlighted in purple with invalidation in red. Confirmation level, where relevant, is a pink dotted, finite line. Fibonacci goals, it is prudent to suggest, are nothing more than mere fractally evident and therefore statistically likely levels that the market will go to. Having said that, the market will always do what it wants and always has a mind of its own. Therefore, none of this is financial advice, so do your own research and rely only on your own analysis. Trading is a true one man sport. Good luck out there and stay safe.

DSX - LongsGot in DSX today
Technical
20 EMA crossing 50 and 100 EMA recently
Strong RS rating
Strong Volume after earnings
Risk
Dry Bulk shipping index declines
China situation could cause a general wider correction
Fundamentals;
Many contracts are Time Charter contracts expiring soon - these should be renewed at better rates and provide an earnings boost
Nice solid earnings recently

DSX Announces Time Charter Contract for m/v Myrto With Tata NYKDSX: Diana Shipping Inc. c/o Diana Shipping Services S.A.
2022-08-01 09:14:00
Diana Shipping Inc. Announces Time Charter Contract for m/v Myrto With Tata NYK

Diana Shipping Inc. Announces Time Charter ContractDSX: Diana Shipping Inc. c/o Diana Shipping Services S.A.
2022-07-18 09:09:00
Diana Shipping Inc. Announces Time Charter Contract for m/v Boston with Aquavita

Diana Shipping Inc. Announces Time Charter ContractsDSX: Diana Shipping Inc. c/o Diana Shipping Services S.A.
2022-07-05 09:29:00
Diana Shipping Inc. Announces Time Charter Contracts for m/v Electra With Refind Success and m/v New York With C Transport.

Diana Shipping Inc. Announces Time Charter ContractDSX: Diana Shipping Inc. c/o Diana Shipping Services S.A.
2022-06-16 09:26:00
Diana Shipping Inc. Announces Time Charter Contract for m/v Selina

Bearish Cyphery Pattern - Elliott Wave Analysis Bearish Cypher Pattern , in Elliott Wave Analysis is
Irregular Flat Correction or Running Flat Correction
Rules
The B point stands at the end of the AB leg, which is a retracement of the XA leg. The B point must lie between a 0.382 and 0.618 retracement of the XA leg;
The C point lies at the end of the BC leg and should be a 1.272 to 1.414 projection of the XA leg;
Point D should be a precise 0.786 retracement of the line between X and C (XC). The D point is the end of the pattern.

Bullish Cypher Pattern - Elliott Wave Analysis Bullish Cypher Pattern , in Elliott Wave Analysis is
Irregular Flat Correction or Running Flat Correction
Rules
The B point stands at the end of the AB leg, which is a retracement of the XA leg. The B point must lie between a 0.382 and 0.618 retracement of the XA leg;
The C point lies at the end of the BC leg and should be a 1.272 to 1.414 projection of the XA leg;
Point D should be a precise 0.786 retracement of the line between X and C (XC). The D point is the end of the pattern.

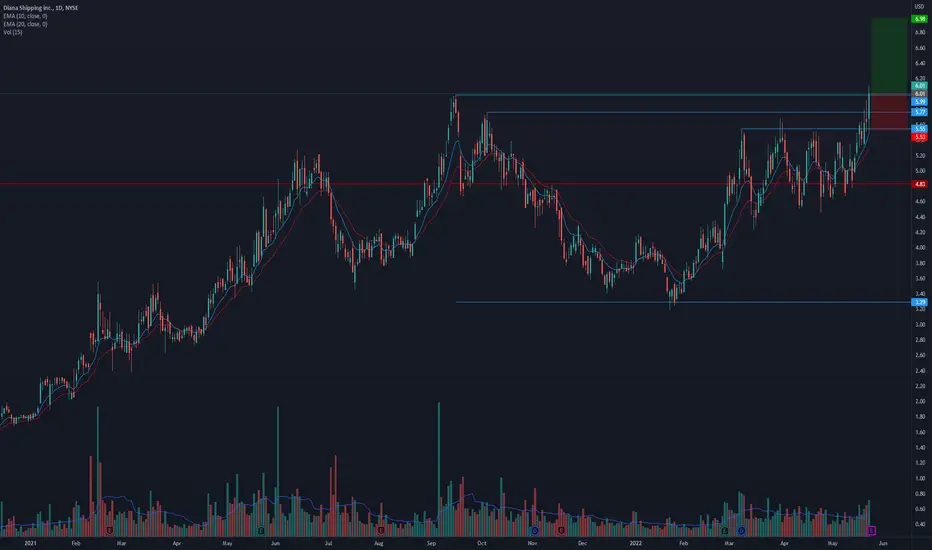
$DSX breaking out of a ~8 month base! Can it go higher?* Steady up trend over the past two years
* Consolidated for about 8 months
* Formed a cup and handle pattern
* Now breaking out of the cup base
Technicals:
* Sector: Industrials - Marine Shipping
* Relative Strength vs. Sector: 20.4
* Relative Strength vs. SP500: 18.49
* U/D Ratio: 1.38
* Base Depth: 82.07%
* Distance from breakout buy point: 0.33%
* Volume 73.26% above its 15 day avg.
Trade Idea:
* You can enter now as the price is just breaking out of its base
* If you're looking for a better entry you can look for one around the $5.77 area
* Given the macro situation of the world it does seem like shipping stocks will move higher in the near future
Diana Shipping Inc. Announces Time Charter ContractDSX: Diana Shipping Inc. c/o Diana Shipping Services S.A.
2022-05-23 09:19:00
Diana Shipping Inc. Announces Time Charter Contract for m/v P.S. Palios With Classic Maritime

Diana Shipping Inc.Announces Time Charter ContractDSX: Diana Shipping Inc. c/o Diana Shipping Services S.A.
2022-05-18 09:27:00
Diana Shipping Inc. Announces Time Charter Contract For m/v Maia with Hyundai Glovis

DIANA Shipping - Ending Diagonal Diana Shipping has an Ending Diagonal.
The ending diagonal is wave 5.
The pattern is active, this is mean that we have change in polarity
and the target is at least 38.2% Fibonacci.

DSX LongNYSE:GE got slammed after earnings and mentioned negative cashflow due to raising freight costs. I'm thinking if you have to ship/export stuff the money is going to the shippers. DSX is currently at the bottom of an ascending triangle on the daily.

DSX breakout anticipation DSX and shippers starting to run so we could see these stocks go for a sizeable run as shippers have had parabolic runs I’m the past.

Diana Shipping Inc. Announces Time Charter ContractDSX: Diana Shipping Inc. c/o Diana Shipping Services S.A.
2022-04-13 09:06:00
Diana Shipping Inc. Announces Time Charter Contract for m/v Philadelphia With C Transport

Diana Shipping to recovery. DSXImmediate targets 4.53, 4.90.
We are not in the business of getting every prediction right, no one ever does and that is not the aim of the game. The Fibonacci targets are highlighted in purple with invalidation in red. Fibonacci goals, it is prudent to suggest, are nothing more than mere fractally evident and therefore statistically likely levels that the market will go to. Having said that, the market will always do what it wants and always has a mind of its own. Therefore, none of this is financial advice, so do your own research and rely only on your own analysis. Trading is a true one man sport. Good luck out there and stay safe

Diana Shipping Inc. Announces Delivery of the Kamsarmax Dry BulkDSX: Diana Shipping Inc. c/o Diana Shipping Services S.A.
2022-02-16 09:07:00
Diana Shipping Inc. Announces Delivery of the Kamsarmax Dry Bulk Vessel m/v Leonidas P. C. and Time Charter Contract for m/v Seattle With Solebay

Diana Shipping Inc. Announces Time Charter Contracts for m/v AliDSX: Diana Shipping Inc. c/o Diana Shipping Services S.A.
2022-02-10 09:08:00
Diana Shipping Inc. Announces Time Charter Contracts for m/v Aliki with Koch and m/v Leonidas P. C. with Cargill

Diana Shipping Inc. Announces Time Charter Contracts for m/v AlcDSX: Diana Shipping Inc. c/o Diana Shipping Services S.A.
2021-11-22 08:56:00
Diana Shipping Inc. Announces Time Charter Contracts for m/v Alcmene With SwissMarine, m/v G. P. Zafirakis and m/v Ismene With Cargill

Diana Shipping Inc. Announces Time Charter Contract for m/v MyrsDSX: Diana Shipping Inc. c/o Diana Shipping Services S.A.
2021-11-09 08:52:00
Diana Shipping Inc. Announces Time Charter Contract for m/v Myrsini With Cargill

DCX: Ascending Triangle (75%)Ascending Triangle, confirmed
All indicators are looking good.
Price target = 9.70%
Stay humble, Have fun, Make money!