DXC: $20 | a Self Healing Tech made for Nvidia Ent. Solutionthis is the app PLATFORM that can ultilize Nvidias open ai technology to its commercial use
the hardware like Cisco and Nvidia took humanity to absrtact levels
now the APPLICATION in that generation shall be as rewarding
just like how the iNTERNET paved way to NETFLIX democratizing knwledge across the universe
in addition
Team behind got access to DC and men behind deals
DXC trade ideas

DXC - JULY 24 MATrend Sustainable Momentum- D1 larger trend is aligned to our bearish direction
MATrend Sustainable Momentum (Systematic) 🚀
This is a variant of the Unsustainable strategy. System identifies stocks (Tech sector) that follows the larger market regime's momentum of the day.

Risking it for a biscuit. Earnings report tonight after the bellDXC are reporting tonight.
Looking at tonight’s price action pre report, price has been rising and on the 5 min time frame higher highs and higher lows have been formed.
On the longer timeline it has underperformed but is now clearly at major support.
A break above the channel should have considerable upside, if results are good this could be the catalyst, obviously it could also go the other way.
Expected earnings $0.82 Billion. Expected revenue $3.36 Billion. Not too shabby

DXC Technology (DXC) - Frequency Formula Strategy - LongStrategy Overview: The Frequency Formula
Our trading strategy, "The Frequency Formula," is built on cutting-edge Fourier Wave Transform theory. The strategy utilizes four unique indicators: the Frequency Formula Chop Indicator (FF-CI), Frequency Formula Trend Indicator (FF-TI), the Frequency Formula Volume Indicator with Combined Ratios (FFVI-CR), and the Frequency Formula Net Buy/Net Sell Volume Indicator (FF-NBNS). Together, they identify optimal entry and exit points based on changes in market trends, volumes, and sentiments.
Why Now Is a Good Time to Enter
The FF-CI and FF-TI suggest that the current market chop and previous bearish trend are transitioning into a solid upward trend. Simultaneously, the FF-UVI-CR indicates increased buying volume and positive sentiment, suggesting strong support for the upward price movement.
What to Look for When Exiting
Keep an eye on our FF-VMI-CR and FF-NBNS Indicators. When the FF-VMI-CR indicator positive volume (blue) and negative volume (red) signals converge or "squeeze", this indicates a significant increase in net selling volume and might indicate a potential trend reversal; also, watch the FF-NBNS indicator's net-selling value (red) to increase and close at any value greater than zero, at this point you should exit the position.
Remember to always manage your risk, and don't invest more than you can afford to lose. Happy trading!

DXC shortEasy stop for 14% first tgt then trailing it on down. Entry on any retest of prior few days support that was broke/ inside day candle. Head and Shoulders toppish :)

$DXC Expect a little (or more) upwards movement$DXC is rounding well, better than $UBER is right now. Looking to go long at market open with the bullish rounding on all indicators. The offset MAs look good, the early onset trend looks good. I think we have something coming. Could be a big move or a small move, but be ready.

$DXC DXC Technology Company LONG Trade SetupFalling Wedge Breakout, one could play a gapclose here.
Buy In: 34.50$
Stop: 32$
TP1/2/3: 42$/46$/52$

DXC FlagDXC has formed a downside flagging formation and has broken through support of the 34.8 level. Before it had held support with only the wicks of the candle cracking it but still closing above it on the day, except for today. I think this is a signal for a further breakdown, maybe down to the 200 sma.

DXC Rebound WaveDXC has had a recent runup and has since consolidate into a correction wave pattern. It has posted a higher low and it looks like it will make another push to the high.

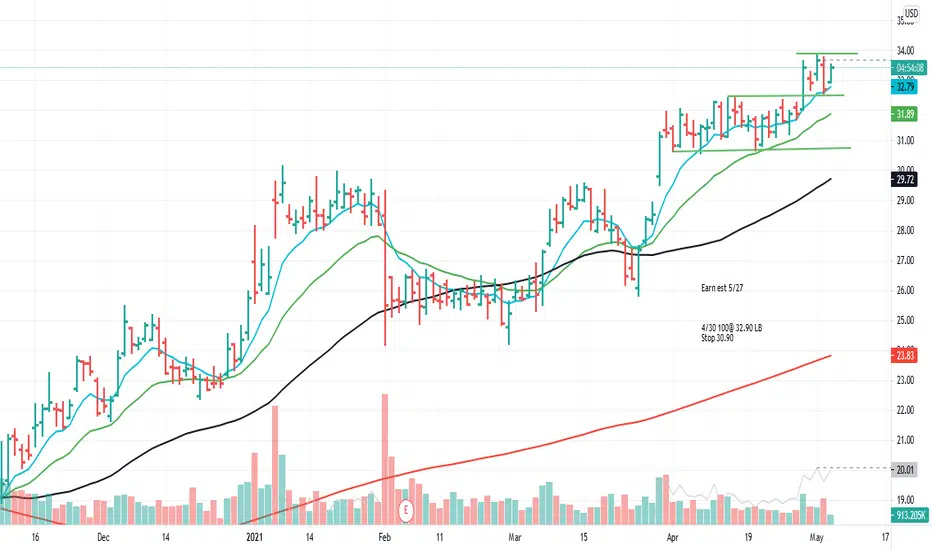
$DXC on Watchlist for Breakout$DXC Here's one that broke out on 4/29 that I missed. Lucky for me it pulled back a bit on 4/30 where I opened a position. I am looking to add to that position if it can break above the upper resistance line I've drawn where I have an alert. Earnings are coming up so need to be mindful. You can see my entry on the chart. I'm hoping this will run into earnings, All TBD. Ideas, Not investing / trading advice.
They last reported earnings on Feb 4
From earningswhispers.com
Dxc Technology Beats
Dxc Technology (DXC) reported 3rd Quarter December 2020 earnings of $0.84 per share on revenue of $4.3 billion. The consensus earnings estimate was $0.54 per share on revenue of $4.2 billion. The Earnings Whisper number was $0.64 per share. Revenue fell 14.6% compared to the same quarter a year ago.
DXC FlagDXC has been consolidating forming a flagging formation. It is only a matter of time before this breakouts out above the 32.5 area towards next resistance levels of 34-35 range. I break beneath the consolidation flag pattern would trigger an exit

DXC SnapbackDXC has had 5 consecutive green run up days. It had a gap up yesterday and traded today on lower volume. This shows the price action is slowing down and declining while being overextended. Its above its upper bollinger band and beyond 90 on stochastics. This is a criteria for a snapback down towards support at 29.60. If it continues to get bought up beyond 32.5, the trade will need to be exited.

DXC - Long Setup Stop 27.93. Momentum Target. Looking for break of 29.63. Recent Insider buying. Small selling.

DXC Finding strength during consolidationDXC took a dip before consolidation in early Feb. The recent market has had very little affect and looks to be reclaiming the three major EMAs. Formed a small pennant which it could break in the coming week. Looks like it would be on a wave 5 of 1. Safer play then trying to jump into the high volatility small caps.

DXC Bollinger Rejection BounceDXC has been trading in a tight consolidated range between 25 and 26.5. It is now at the top of the range with a weak overall market currently. I believe this will get rejected off the bollinger band and go to the bottom of the range around 24.5.

BULLISH -Stillis it a reversal of trend. If one looks at the monthly chart, bullish sentiment is intact and so is weekly chart. mind the level of supports and resistances (trenline, fibo level) as indicated on the chart. Heikin Ashi on monthly chart is nice too. Worth investing as the fundamental aspect of this stock is quite impressive. worth every penny i suppose.

DXC possibly making a Bullish PennantI would look to get in at $27 if possible so the risk isn't as much but I don't know if it will go that low. I personally think it can reach $32 easily and have a shot out going farther. On the Fibonacci retracement(3 of them), you can see there are multiple support levels at $28.50. PLEASE COMMENT WHAT YOU THINK!

Dxc has clear movementI think the buyers won't support the price therefore a sell-off I predict the price will go down to $27 where I will be looking to scoop it up at an even better bargain than it already is. I personally think DXC fair value is around $37. But we see resistance levels at $31 so to give myself that extra room I'm waiting until the $27 range. Please do not take this as any kind of advice. If you like this give it a thumbs up.

DXC BullishMACD crossing and a test of the 50% fibonacci level. Looking for a break of $26.04 to go long. First target $26.93

DXC another sleeper?Found this on my scanner as well, annotated my analysis on my chart. Need to do more research on the financials but this looks like a good set up and has a lot of potential for recovery.

DXC has gotten beaten down. Potential 5 bagger in there?I don't want to get ahead of myself, but could it be like this? DXC got beaten down by 2020, but who's to say it won't rise from the grave and rally? Looks like a lot of potential upside here. Haven't done my DD on the company fundamentals but I'll be eyeballing this one.

PAY to DXC TECHNOLOGY COMPANY DailyHey my friends, DXC TECHNOLOGY COMPANY is in a bullish momentum with a hammer candle and low sell volume traded. Looking at the TIMEFRAME M1 we see an upside down hammer candle with a high volume of purchase issued, it is going to its last lowest. Then wanting to turn around, it will breakout its price and subsequently breakout a range to land in the next and head to the next high (See TIMEFRAME H4) for confirmation. And if the buyers are back, arrive on the top of the top and go to test the last top.
This corresponds to the breakout a new comfort zone with a bullish excess behind. Not enough power to test the TREND-BASED FIBONACCI EXTENSION.
Please LIKE & FOLLOW, thank you!

DXC BounceDXC has ran up into its nearest resistance at the 23 level, i expect a bounce off that resistance back down to the moving average level around 21. If it continues to run up beyond 24 then this setup is invalid and i'll exit trade.
