ETN - Break Previous HighHello Everyone,
This is the 3rd one that i would like to mention.
What they do?
Eaton Corporation focuses on solving challenges in electrical, aerospace, hydraulic, and vehicle products (including eMobility) through its power services. These products promote efficiency and safety for industry usage. In dealing with electrical demands, Eaton is one of the top four large global players in the worldwide low- and medium-voltage electrical market.
Financial Highlights:
Record First Quarter Results: Eaton reported with strong sales and profit growth across its segments.
Aerospace Segment: Record sales of $979 million, up 12% organically.
Vehicle Segment: Sales of $617 million, down 15% due to organic and currency impacts.
Organic Growth: Continued strong organic growth across the company.
Backlog: The backlog in the Aerospace segment was up 16% organically.
Full Year 2025 Guidance:
Organic Growth: 7.5-9.5%.
Segment Margins: 24.0-24.4%.
Earnings per Share: Between $10.29 and $10.69, up 10% at the midpoint.
It pays also dividend , current dividend yield %1.04
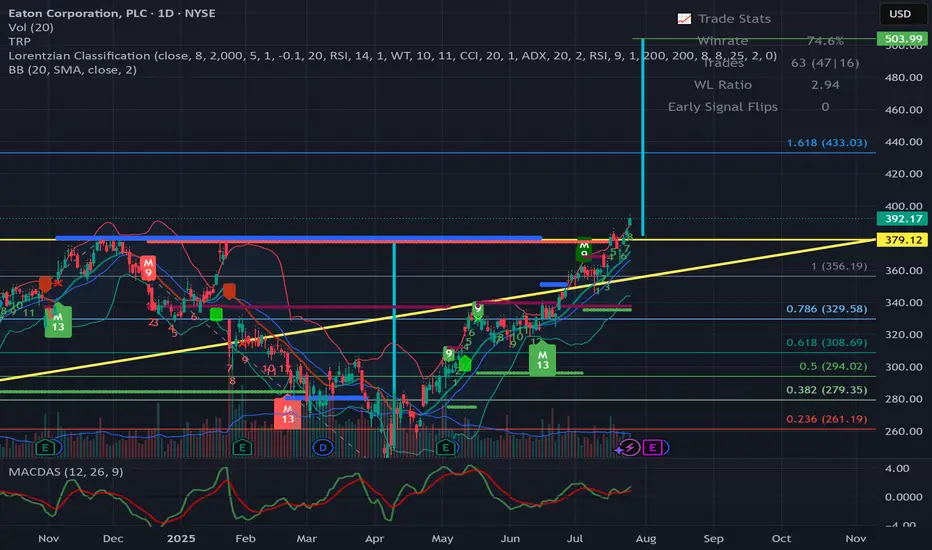
So, on Thursday it broke the previous high which was reached the last year on December.
On Friday it continue to go high.
Options : it can re-test the 379 the go up to 500 - 505 , or directly it will go to UP till reach to 500-505.
First resistance is in 433.
This is one of the stocks that has really big potential for me and other advance is they are paying dividends. But all in all my expectations are quite high for this company.
This is just my thinking and it is not invesment suggestion , please do not make any decision with my anaylsis.
Have a good start a Weekend
ETN trade ideas
Eaton Corporation ($ETN) – Strong High in Sight, Structural ExpaNYSE:ETN has officially broken out of its multi-month compression range, reclaiming key BOS zones and leaving behind a clear discount-to-premium trajectory. With demand reestablished near equilibrium and strong follow-through volume, we’re now eyeing a run toward the structural high at $422.46.
🔍 Technical Highlights (1D):
✅ Confirmed BOS after sweeping discount and reclaiming mid-channel support
🔴 Premium zone at $366–$390 is the only major resistance before upside extension
🔼 Smart Money Concepts: Clean CHoCH → BOS → Expansion
🧭 Price is now inside an HTF ascending channel with measured move targeting upper trendline near $420–$440
🧠 Macro Context & Catalysts:
⚙️ Eaton benefits from strong secular demand in electrification, infrastructure, and defense sectors
🏗️ Tailwinds from the Inflation Reduction Act, grid modernization, and global energy transition
💰 Institutional rotation into high-cash-flow industrials with clean balance sheets
📊 June's PMI data hints at reacceleration in U.S. manufacturing
🧪 Trade Setup:
Entry Zone: $350–$356 (on pullbacks into breakout candle)
Stop Loss: Below $340 (invalidates HTF BOS)
Targets:
🎯 TP1: $366 (premium zone)
🎯 TP2: $390–$422 (final structure target)
📊 Bias: Bullish Continuation
📆 Timeframe: Multi-week swing
🧠 For educational use only – not financial advice.
🔗 Posted by WaverVanir_International_LLC
(APA7: TradingView, 2025)

Trade Idea: ETN (Eaton Corporation) - Breakout OpportunityTicker: ETN (NYSE) | Sector: Industrial/Energy Infrastructure
📈 Trade Setup
Entry: $340.5 (Current price near breakout level)
Stop Loss: $315 (-7.5% from entry)
Take Profit: $391.68 (+15% upside)
Risk/Reward Ratio: 1:2
🔍 Technical Analysis
Trend & Momentum:
Daily Chart: Strong uptrend (Higher highs & higher lows).
RSI (14): 62 (Bullish but not overbought).
MACD: Bullish crossover above signal line.
Key Levels:
Support: $315 (200-day SMA + previous resistance turned support).
Resistance: $350 (Psychological level), then $391.68 (ATH projection).
Volume: Rising on upward moves (bullish confirmation).
💡 Fundamental Catalyst
Sector Tailwinds:
Global energy infrastructure spending surge (grid modernization, data centers).
ETN’s exposure to electrification and renewable energy plays.
Valuation:
P/E: 33.5 (slightly rich but justified by growth).
Strong free cash flow (+12% YoY).
🎯 Why This Trade?
Breakout Play: ETN is testing a multi-week consolidation. A close above $345 confirms bullish momentum.
Sector Strength: Industrials outperforming S&P 500 YTD.
Low Relative Volatility: ATR of ~$8 suggests controlled risk.
⚡ Trade Management
Add-on: Consider adding at $355 if volume supports the breakout.
Adjust SL: Move to breakeven at $350 if price reaches $365.
Watchlist: Monitor XLI (Industrial ETF) for sector confirmation.
⚠️ Risks
Market Pullback: Broad selloff could drag industrials.
Earnings Volatility: Next report due in ~3 weeks.
📉 Chart Note:
"ETN is poised for a measured move to ATHs if $345 breaks. SL below $315 keeps risk defined."
✅ Verdict: High-conviction swing trade with clear technical structure.
#ETN #Breakout #IndustrialStocks #SwingTrading
(Disclaimer: Not financial advice. Do your own research. Past performance ≠ future results.)

ETN: Bullish Cup & Handle Pattern Targets All-Time HighsOverview:
On the daily timeframe (D TIMEFRAME), ETN appears to be forming a well-defined Cup and Handle chart pattern, a classic bullish reversal and continuation pattern. The price has recently completed the "cup" formation and is currently consolidating within what appears to be the "handle," right at a critical resistance level.
Pattern Identification:
The Cup Formation:
From approximately late January 2025 to late April 2025, ETN experienced a significant decline, finding a bottom around the 240-250 area, and then rallied back up to the neckline. This U-shaped recovery forms the "cup" portion of the pattern. The depth of the cup is substantial, indicating a strong base formation.
The Neckline (Current Resistance 333):
The "rim" of the cup is established at the 333 level. This level is highly significant as it acted as strong support in late 2024/early 2025 before the breakdown. Now, it has flipped to become a formidable resistance. The stock previously rejected this level around late May/early June.
The Handle Formation:
Following the first test of the 333 neckline, ETN pulled back slightly and has been consolidating in a shallower, rounded fashion, forming the "handle." This consolidation is crucial, as it allows for profit-taking by early buyers and builds energy for the next leg up. The handle is holding well above the 310.31 level.
Key Price Levels & Trade Setup:
Current Price: Approximately 330.70.
Key Resistance / Neckline: 333.00. This is the critical level to watch. A confirmed breakout above this resistance is necessary to validate the Cup & Handle pattern.
Initial Support: The bottom of the handle, around 310.31, serves as immediate support.
Stop Loss (SL): A sensible stop-loss would be placed just below the handle's low, specifically at 310.31. A daily close below this level would invalidate the bullish pattern and suggest further downside.
Target Price (TP): The traditional target for a Cup & Handle pattern is measured by the depth of the cup projected from the neckline.
Cup Depth: Approximately 380 ~240 (bottom) = ~140 points.
From the chart, the target is clearly marked as the All Time High 380.00. This aligns well with the pattern's measurement if the handle forms slightly lower or simply indicates the next major psychological and historical resistance. A move above 333 opens the path directly to 380.
Trading Strategy:
Entry: Traders could consider initiating a long position upon a confirmed bullish breakout above the 333 necklines. This confirmation could be a strong daily candle close above 333 or waiting for a successful retest of 333 as new support after the breakout.
Risk Management: With an entry around 333 and a stop loss at 310.31, the risk is approximately 22.69 points. The target at 380 provides a potential reward of approximately 47 points. This offers a favorable Risk/Reward ratio of roughly 2:1.
Invalidation: The bullish thesis is invalidated if ETN fails to break above 333 and instead breaks down below the handle's support at 310.31, especially on a daily closing basis.
Concluding View:
ETN presents a compelling technical setup with a maturing Cup & Handle pattern. The stock is currently poised at a pivotal resistance level. A successful breakout above 333 would signal significant bullish momentum, potentially driving the price towards its all-time high of 380. As always, solid risk management is paramount.
Disclaimer:
The information provided in this chart is for educational and informational purposes only and should not be considered as investment advice. Trading and investing involve substantial risk and are not suitable for every investor. You should carefully consider your financial situation and consult with a financial advisor before making any investment decisions. The creator of this chart does not guarantee any specific outcome or profit and is not responsible for any losses incurred as a result of using this information. Past performance is not indicative of future results. Use this information at your own risk. This chart has been created for my own improvement in Trading and Investment Analysis. Please do your own analysis before any investments.

I know what I will be ETN for dinnerPuns aside, ETN is ready to take off. I am going to spare the technical and fundamental support that says price is about to go parabolic. Instead I will leave you with a thought... imagine you did not buy and price went to the moon?

ETN Looking A Nice WagyuShe's a beauty! A pullback with second entry long and a measure move objective above.

it would be safer to 240 againA different POV on this one but after today's close and RSI looking for some headwind to close out of its jump to resistance and beyond 70.

ETN - Increased Probability of AppreciationThe Fibocloud configuration indicates an increased probability of appreciation towards the first target. The final target should be tested, provided the stop loss is properly repositioned at the time of the first partial realization.
If this projection is confirmed and a partial realization occurs at the first target, the stop loss should be moved from its initial position to the same line where the position was opened.
This way, the journey towards the final target will proceed with the preservation of the partial gain and an exponential reduction in the risk of losses in the trade.
Let's see what happens here?
Follow us to receive notifications of new trades as well as frequent updates on ongoing trades.
Finally, if you agree with the idea or found it useful, please give it a BOOST so that it can reach a larger number of people!

Eaton Corporation Weekly SetupETN passes the Weekly breakout criteria with high volume and good fundamentals. With a favorabel risk/reward of almost 1:2, I will be on a look out for a follow through on Monday open.

Eaton should target 292 then 330Daily Chart, the stock is trading upwards with tendency to hit the Resistance R3. After crossing at around 254, the target will be 292 then 330
Technical indicators MACD and RSI are positive.
Stop loss below 224 should be considered.

ETN shortHi traders,
We are expecting the price to go higher and retest previous all time high.
And get rejected. Next, we expect pullback towards Fib level 0.5 (215.83) and from there another bounce.
Entry, target and stop loss are shown on the chart.


$ETN with a bullish outlook following its earnings #StocksThe PEAD projected a bullish outlook for NYSE:ETN after a positive under reaction following its earnings release placing the stock in drift A with an expected accuracy of 62.5%.

Is Eaton Attempting a Breakout?Eaton has flirted with record highs, and some traders may be looking for a breakout.
The first pattern on today’s chart is the price level around $175 where ETN peaked in late 2021. The industrial stock inched above the peak in March before pulling back. In the process, it made a higher quarterly low (for the fourth straight quarter). That tightening price action could suggest investors are willing to buy at increasingly higher prices.
Second, previous dips brought the shares below their 50-day simple moving average (SMA). But this month they managed to bounce at that line – a potential sign of the intermediate-term trend improving.
Third, earnings have beaten estimates for the last several quarters.
Finally, the 8-day exponential moving average (SMA) crossed above the 21-day EMA about a month ago and has remained there since. That may indicate the shorter-term trend is bullish again.
TradeStation has, for decades, advanced the trading industry, providing access to stocks, options, futures and cryptocurrencies. See our Overview for more.
Important Information
TradeStation Securities, Inc., TradeStation Crypto, Inc., and TradeStation Technologies, Inc. are each wholly owned subsidiaries of TradeStation Group, Inc., all operating, and providing products and services, under the TradeStation brand and trademark. TradeStation Crypto, Inc. offers to self-directed investors and traders cryptocurrency brokerage services. It is neither licensed with the SEC or the CFTC nor is it a Member of NFA. When applying for, or purchasing, accounts, subscriptions, products, and services, it is important that you know which company you will be dealing with. Please click here for further important information explaining what this means.
This content is for informational and educational purposes only. This is not a recommendation regarding any investment or investment strategy. Any opinions expressed herein are those of the author and do not represent the views or opinions of TradeStation or any of its affiliates.
Investing involves risks. Past performance, whether actual or indicated by historical tests of strategies, is no guarantee of future performance or success. There is a possibility that you may sustain a loss equal to or greater than your entire investment regardless of which asset class you trade (equities, options, futures, or digital assets); therefore, you should not invest or risk money that you cannot afford to lose. Before trading any asset class, first read the relevant risk disclosure statements on the Important Documents page, found here: www.tradestation.com .

Trading $ETN to above $200Management also raised its organic growth guide for Electrical Americas on sustained strength of end market demand. Data centers (~14% of total revenues) remain a bright spot, and the company upgraded its expectations for Utility (~10%) and Residential (~8%) end markets.
Eaton has a large number of “mega-projects,” with a decent track record of winning. The influx of stimulus driving electrification and reshoring, Eaton is on the medium-term growth runway.


EATON Corporation, NYSE - Monthly Chart from the beginningEATON Corporation, PLC.
At stock exchange from the early beginning in the late '20s from the last century. An ongoing story of success.
Don't make the mistake to expect reaching the mentioned values at the ground time scale. There is no connection between these two objectives in Elliott Wave theory (!).
The share price should reach 222 US-$. After a correction in three waves in blue 254 US-$ should be the next step before Grand Super Cycle wave I in a circle (burgundy) will come to an end and a longer lasting A, B, C - correction will start and 'll lead the value of the share in the region around 120 US-$.
I, II, III...
The drawings are schematically - and the future is mentioned.

Long weekly idea - ETN13/Feb/2023 07:23 PM AUTHOR: Brandon Gum
--
Risk to prior lows. High probability setup with initial stop loss entry criteria.
Measured-move take profit established from the inverted%move of the October 2022, inverted at the neckline ~$175
Daily is a lot choppier than weekly.
Industrials are strong. Rising tide lifts all boats.
THis strategy only works if breakouts continue to work. THis move is only permitted if the mrkt breadth allows it. Rising tide environment.
I have no position at this time.
============================================

$ETN with a Bullish outlook following its earnings #Stocks The PEAD projected a Bullish outlook for $ETN after a Positive over reaction following its earnings release placing the stock in drift B with an expected accuracy of 50%.

$ETN with a Bullish outlook following its earnings #Stocks The PEAD projected a Bullish outlook for $ETN after a Positive Under reaction following its earnings release placing the stock in drift A with an expected accuracy of 57.14%.

The primary trend: Eaton Since the 31. December we can see a clear downtrend of the Eaton stock.
Will Eaton beat the trend by the end of the month?

$ETN with a Bullish outlook following its earnings #Stocks The PEAD projected a Bullish outlook for $ETN after a Negative over reaction following its earnings release placing the stock in drift C with an expected accuracy of 60%.

ETN ShortETN Short
Failed breakout attempt to the upside after months of consolidation
Pul back to supply zone with a retest of the zone
Wide range igniting bar/candle to the downside with new candles consolidating at the lower 1/3 of the wide range bar
Expecting a move lower if today´s low is broken
