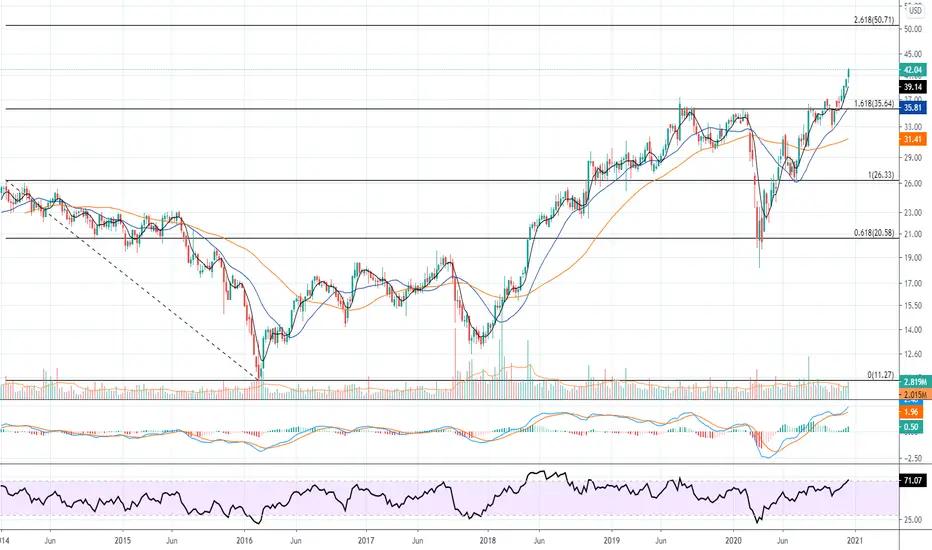
Buy signal - VCP with UC&RWith EVTC i see two buy signals - both based on the teachings of my masters - M. Minervini and G. Morales.
First we see a VCP over the last few days (it was also on a short list from our VCPSniper). What is interesting when you look at in details is that we see a 'shakeout' (following MM rules of V
Next report date
—
Report period
—
EPS estimate
—
Revenue estimate
—
2.16 USD
112.62 M USD
845.49 M USD
62.97 M
About Evertec, Inc.
Sector
CEO
Morgan M. Schuessler
Website
Headquarters
San Juan
Founded
1998
FIGI
BBG000J187K0
EVERTEC, Inc. engages in the provision of transaction services. It operates through the following segments: Payment Services-Puerto Rico and Caribbean, Payment Services-Latin America, Merchant Acquiring, Business Solutions, and Corporate and Other. The Payment Services segment is involved in the authorization, processing, management and recording of automated teller machines (ATM) and point of sales transactions, and ATM management and monitoring. The Merchant Acquiring segment offers services to merchants of all sizes, enabling them to accept all types of electronic payments. The Business Solutions segment consists of bank processing, network hosting and management, information technology professional services, business process outsourcing, item processing, cash processing, and fulfillment. The Corporate and Other represents corporate overhead, certain leveraged activities, other non-operating expenses, and intersegment eliminations. The company was founded in 1998 and is headquartered in San Juan, Puerto Rico.
Related stocks

US stocks setting up VCPs for possible buys (Minervini template)Todays list of stock showing VCP qualities.
Trade safely! As i commented under the last video - number of names completely cancelled VCP setup by moving through the bottom range.
In this video i also share the combination of VCP with UCR (undercut rally as per Gil Morales).
Safe trading to all!

Upward trend continuation expected with earnings reportEvertec, Inc is a transaction processing business in Latin America and the Caribbean. Earnings report for Monday is expected to be positive (.55 EPS). Chart looks bullish with the continuation of the fifth wave trending upwards, bullish MACD indicators and bullish candlestick patterns.
Visit ever

EVTCCould consolidate for a couple weeks before heading to $50, but I wouldn't be surprised if it didn't.


See all ideas
Summarizing what the indicators are suggesting.
Neutral
SellBuy
Strong sellStrong buy
Strong sellSellNeutralBuyStrong buy
Neutral
SellBuy
Strong sellStrong buy
Strong sellSellNeutralBuyStrong buy
Neutral
SellBuy
Strong sellStrong buy
Strong sellSellNeutralBuyStrong buy
An aggregate view of professional's ratings.
Neutral
SellBuy
Strong sellStrong buy
Strong sellSellNeutralBuyStrong buy
Neutral
SellBuy
Strong sellStrong buy
Strong sellSellNeutralBuyStrong buy
Neutral
SellBuy
Strong sellStrong buy
Strong sellSellNeutralBuyStrong buy
Displays a symbol's price movements over previous years to identify recurring trends.
Frequently Asked Questions
The current price of EVTC is 34.75 USD — it has decreased by −3.87% in the past 24 hours. Watch Evertec, Inc. stock price performance more closely on the chart.
Depending on the exchange, the stock ticker may vary. For instance, on NYSE exchange Evertec, Inc. stocks are traded under the ticker EVTC.
EVTC stock has risen by 4.86% compared to the previous week, the month change is a −5.67% fall, over the last year Evertec, Inc. has showed a −4.72% decrease.
We've gathered analysts' opinions on Evertec, Inc. future price: according to them, EVTC price has a max estimate of 44.00 USD and a min estimate of 34.00 USD. Watch EVTC chart and read a more detailed Evertec, Inc. stock forecast: see what analysts think of Evertec, Inc. and suggest that you do with its stocks.
EVTC reached its all-time high on Dec 8, 2021 with the price of 51.06 USD, and its all-time low was 11.27 USD and was reached on Feb 19, 2016. View more price dynamics on EVTC chart.
See other stocks reaching their highest and lowest prices.
See other stocks reaching their highest and lowest prices.
EVTC stock is 4.13% volatile and has beta coefficient of 0.77. Track Evertec, Inc. stock price on the chart and check out the list of the most volatile stocks — is Evertec, Inc. there?
Today Evertec, Inc. has the market capitalization of 2.22 B, it has decreased by −4.46% over the last week.
Yes, you can track Evertec, Inc. financials in yearly and quarterly reports right on TradingView.
Evertec, Inc. is going to release the next earnings report on Oct 30, 2025. Keep track of upcoming events with our Earnings Calendar.
EVTC earnings for the last quarter are 0.89 USD per share, whereas the estimation was 0.87 USD resulting in a 2.54% surprise. The estimated earnings for the next quarter are 0.89 USD per share. See more details about Evertec, Inc. earnings.
Evertec, Inc. revenue for the last quarter amounts to 229.61 M USD, despite the estimated figure of 225.61 M USD. In the next quarter, revenue is expected to reach 224.69 M USD.
EVTC net income for the last quarter is 40.47 M USD, while the quarter before that showed 32.70 M USD of net income which accounts for 23.73% change. Track more Evertec, Inc. financial stats to get the full picture.
Yes, EVTC dividends are paid quarterly. The last dividend per share was 0.05 USD. As of today, Dividend Yield (TTM)% is 0.58%. Tracking Evertec, Inc. dividends might help you take more informed decisions.
Evertec, Inc. dividend yield was 0.58% in 2024, and payout ratio reached 11.56%. The year before the numbers were 0.49% and 16.51% correspondingly. See high-dividend stocks and find more opportunities for your portfolio.
As of Aug 3, 2025, the company has 4.8 K employees. See our rating of the largest employees — is Evertec, Inc. on this list?
EBITDA measures a company's operating performance, its growth signifies an improvement in the efficiency of a company. Evertec, Inc. EBITDA is 314.83 M USD, and current EBITDA margin is 35.05%. See more stats in Evertec, Inc. financial statements.
Like other stocks, EVTC shares are traded on stock exchanges, e.g. Nasdaq, Nyse, Euronext, and the easiest way to buy them is through an online stock broker. To do this, you need to open an account and follow a broker's procedures, then start trading. You can trade Evertec, Inc. stock right from TradingView charts — choose your broker and connect to your account.
Investing in stocks requires a comprehensive research: you should carefully study all the available data, e.g. company's financials, related news, and its technical analysis. So Evertec, Inc. technincal analysis shows the neutral today, and its 1 week rating is sell. Since market conditions are prone to changes, it's worth looking a bit further into the future — according to the 1 month rating Evertec, Inc. stock shows the sell signal. See more of Evertec, Inc. technicals for a more comprehensive analysis.
If you're still not sure, try looking for inspiration in our curated watchlists.
If you're still not sure, try looking for inspiration in our curated watchlists.