Frontline in the end of correction waveFrontline has made its final correction wave, and an upward momentum may follow from here.
The RSI oversold position indicates a bottom. It quickly rose from around 151 to the 160s. It could provide a good return for the first quarter of 2025.
Purchases can be made at these prices with a stop at 151, and profits can be taken at resistance levels.
This is not investment advice.
FRO trade ideas

Frontline FRO possible Breakout targeting $28Analysis
Trendline Breakout: Recently broke above a downward trendline; potential for bullish momentum.
Support and Resistance: Watch for support near the trendline and next resistance around 25-26 levels. Recent high volatility.
Key Points for Trading:
Entry Point: Consider entering on pullbacks to the trendline if volume confirms.
Risk Management: Set tight stop-losses below the trendline.
Target: Aim for resistance levels at $26,60 and $28,60 for potential profit taking.
Continued Monitoring: Watch price action and volume for sustained breakout strength.
Trend Forecast:
Bullish Bias: Short-term bullish trend possibly forming.
Support Level: Watch for support around the $23 mark.
Resistance Level: Immediate resistance near $25-$26.
Forecast Summary:
Expected Movement: Potential retest of resistance near $25-$26, with pullbacks to support.
Triggers: Earnings reports, market news, or geopolitical events could impact movement.
Risk: Tighten stop-losses to manage risk effectively.

$FROGreen: Entry Point
Blue: Start of Week
Red: End of Week
Thumbs Up: Trade Available for Week
Numbers: Price Targets
*For share traders only. Not meant for options.

Frontline Ltd ADR (FRO) NYSE - Long?Okay so a nice pullback and price is starting to move back to the upside.

frontlineFrontline has been in accumulation for more than a decade. this looks like it is bound to move up for a much bigger move as it continues to respect the monthly uptrend.
the highest i see it go this year is at the untested weekly levels (solid purple lines) at $38-$47.
if it breaks below the tested weekly support, it will most likely test the weekly uptrend. If the uptrend breaks, there will be a significant drop to $16-$14.

FRO Continuation Head and ShouldersNice looking continuation head and shoulders pattern on NYSE:FRO
After today's action. Its time to sit out and let things settle in for now. Hard to be jumping back in right away.

FRONTLINE PLC Long - Dollar Cost AverageThis is an analysis of Frontline PLC - a Norwegian oil transportation company, the following is strictly my own personal opinion and does not constitute financial advice.
Key numbers:
Dividend yield expected 2024 - 17%
P/B - 2.03
P/E - 5.41
Market cap 47 178 MNOK (4.5 BUSD)
Analyst estimates:
Analyst estimate average for FRO is 267.5 NOK which is equivalent to a 32.3% increase from todays price.
Key information:
FRO has had a significant increase in price the past 6 months, and analysts estimate an increase in both dividends and growth for the company in the coming years.
Technical analysis:
FRO made a bullish divergence on the 195-200 support level recently, after a significant sell off the past few weeks the stock did not even drop as a result of dividends being paid out to stock holders, and I see this as a sign of the stock being about to reverse the downwards trend and begin to move back towards my price target of 260-280.
Strategy:
I am currently in possession of FRO shares with a GAV of 150 NOK/Share as well as increasing my position on friday for 200 NOK/Share. I am looking to hold these shares until price reaches 260-300 NOK/Share depending on coming events. If the price keeps moving down, I will look to hold my position until the stock reaches my price target regardless, as the dividend payout is significant. This might change if significantly bearish news arise, but I do not see that as a high probability at this moment.
If price reaches my profit target, I will again look at analyst estimates and given there is no change I will exit my position for a significant gain. If analyst estimates increase I will either close part of my position or hold it until bearish divergence on the 4H timeframes.

FRO S and R + Possible moves. Possible move prediction for FRO. Maybe top is in, maybe not?
Possible moves in support and resistance zones

FRO - cup with handleFrontline (FRO) is one of the world's largest oil tanker operators, boasting a young and modern fleet, with a particular expertise in operating Very Large Crude Carriers (VLCCs). The global oil tanker market is currently facing significant turbulence due to European nations imposing a price ceiling of $60 per barrel on Russian crude oil, which has led to a limited supply of available tankers. This embargo and price cap have substantially increased the operational mileage of the global oil tanker fleet, rapidly driving up Time Charter Equivalent (TCE) rates. Demand in the Asia-Pacific region has been on the rise, particularly with China setting new records for crude oil imports. However, China's import figures appear inconsistent with other macroeconomic indicators, potentially posing risks. It is anticipated that there will be approximately 2 million barrels per day of global crude oil demand growth in the second half of the year, which bodes well for the industry. The G7's imposition of an oil price cap on Russia may affect Russian supplies and could have implications for the supply-demand balance in the global oil market.
Profitability Model: The primary means of profit generation in the oil tanker market is the difference between revenue and capital costs, as well as operating expenses, with profitability closely tied to lease rates. FRO's lease rates for VLCCs in the second quarter of 2023 indicate that its income from these vessels is the highest relative to other types of tankers, resulting in high profitability.
Fleet Status: FRO confirmed on October 9, 2023, that it has agreed to purchase 24 Very Large Crude Carriers (VLCCs) from Euronav (NYSE: EURN) at a price of $2.35 billion. This transaction will increase its overall fleet size from 65 vessels to 89, making it the largest crude oil transportation company globally. This move is expected to have a highly value-enhancing impact on earnings per share and free cash flow, improving its dividend capacity. Currently, global orders for large VLCCs are at historic lows. Historically, facing an industry characterized by low production elasticity, low VLCC vessel orders can easily lead to price increases in the future.
Financial Situation: FRO possesses robust profitability, with an EBITDA margin TTM of 52.93% and a Levered Free Cash Flow Margin of 11.17%. The dividend yield stands at 12.47%. Following the purchase of 24 large crude oil transportation vessels from EURN, revenue and profitability are expected to increase significantly. It is indeed a Cashcow stock.

(FRO) Surges in value As Market Takes a DipIn the latest trading session, Frontline (FRO) closed at $20.39, marking a +0.99% move from the previous day. The stock exceeded the S&P 500, which registered a loss of 0.63% for the day. Meanwhile, the Dow lost 0.51%, and the Nasdaq, a tech-heavy index, lost 0.63%.
Shares of the shipping company have appreciated by 20.83% over the course of the past month, outperforming the Transportation sector's loss of 2.4% and the S&P 500's loss of 2.35%.
Investors will be eagerly watching for the performance of Frontline in its upcoming earnings disclosure. The company's upcoming EPS is projected at $0.45, signifying a 21.62% increase compared to the same quarter of the previous year. Meanwhile, the latest consensus estimate predicts the revenue to be $250.3 million, indicating a 19.85% increase compared to the same quarter of the previous year.

FRO | Bullish undervalued - Long at Fib level 3BULLISH INDICATOR (Sep 04)
1. Bullish HH and HLs trend is seen and next HL is expected with current price at 17.48.
2. The Heikin Ashi candles are showing a natural pull back in bearish direction but after testing the Fib level 31.8%, price-action is expected to turn in bullish direction.
3. There is a support at Fib level 31.8% @ 17.22, which is expected to play to allow bullish trend to proceed.
4. The bullish trendline is intact and third touch point will meet price action at Fib level 31.8% @ 17.22.
5. The price-action was in a CONSOLIDATION phase from June 2016 till Jan 2023. In 2023 the price-action has broken off in bullish direction from the rectangular box pattern.
6. No ABCD bearish harmonic pattern noticed.
7. The price-action is above 200 EMA, which is a good sign. If it crosses 200-EMA in downwards direction then we shall prepare to liquidate our positions.
BEARISH INDICATOR (Sep 04)
1. The recent bullish trend has not broken the pervious HH of Mar 1st 2023.
2. The Heikin Ashi candles are showing a natural pull back and next LH and LL could be seen but chances are less.
3. There is a bearish divergence noticed on daily timeframe, which needs to be watched.
PREDICTIONS
1. There are more bullish indications than the bearish indications.
2. The stock is available at a very good price with P/E @ 5.4. I will recommend waiting till price traced to 17.22 till Fib 31.8% level before buying.
3. There is a bearish divergence but if the price drops below 16.23 and crosses 200-EMA downwards then bearish reversal will be confirmed.
BIAS 1 = LONG - PLAN A (Pending Buy Limit @ 17.22 Market)
BIAS 2 = SHORT - PLAN B, (If you already hold FRO then plan to sell them when price crossed 14.43 downwards)
TRADE PLAN
———————
PLAN A: Long (Buy Limit)
EN1: 17.22 (Buy Limit)
SL1: 14.43
TP1: 17.24 - RR: 1.45

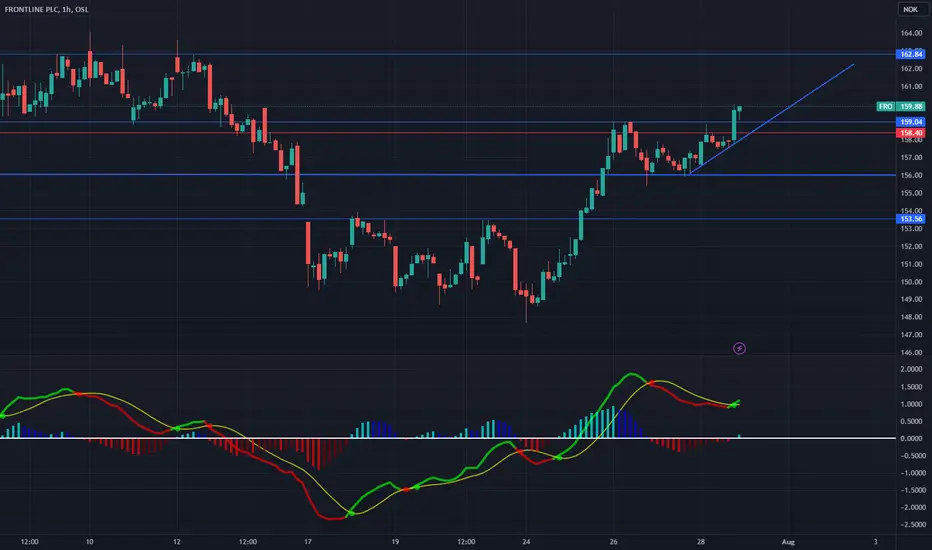
Analyse mandag Om Prisen holder seg på 159 kr på morgenen, kan den klatre videre til 162 kr. Om vi åpner svakt kan den raskt synke ned til 152 kr hvor den kan ligge en stund å lade opp til en ny oppgang.

FRO -- Long--Cup base pattern
--Breakout from a handle
--Hold support on the long trend line
--Risk: similar pattern of $EURN, these two stocks had merged. $EURN earning due in two days. Stocks will react. FED meeting tomorrow, but I don't think the FED meeting will have that much impact on these marine shipping stocks like the tech stocks.
--Reward: Marine shipping stock had good ER. See $STNG, stock was up after earning. There still demand for oil transportation. And I think this is the reason why marine shipping stocks all up from a couple days of pull back.
--Avoid choppy price action.

Overbought FRO - Prepare for a pullback RSI oversold, Current price with a too big gap down to EMA20. ER around the corner.
Looking for a pullback to one of the 3 support lines before a new more up.


FRO Cup&HandleI am anticipating a trend reversal, and a begining of a new uptrend, as you can see from a weekyly chart, Cap and Handle was formed price broke out to above "handle" trend line.

Just following my investment 📈✅Starting an new uptrend ?
They are giving us some good long term signals
Over MA 200 ✅
Over MA 50 ✅
Made bullish cross ( long term ) ✅
Formed an C/H aswell ✅
Made 1-2-3 ( higher highs ) ✅
lets see if it wanna continue, next stop is to get over the resistance line and then there should be an free run up minimum 20 %
We will see, im long and heavy invested in this stock .
DO YOUR OWN ANALYSIS 🙏

FRO - Breaking higher ahead of earningsAre Investors looking for tankers like Frontline Ltd. to begin a surge higher?

$FRO can fall in the next daysContextual immersion trading strategy idea.
Frontline Ltd., a shipping company, engages in the seaborne transportation of crude oil and oil products worldwide.
The demand for shares of the company looks lower than the supply.
This and other conditions can cause a fall in the share price in the next days.
So I opened a short position from $6,77;
stop-loss — $7,10.
Information about take-profits will be later.
Do not view this idea as a recommendation for trading or investing. It is published only to introduce my own vision.
Always do your own analysis before making deals. When you use any materials, do not rely on blind trust.
You should remember that isolated deals do not give systematic profit, so trade/invest using a developed strategy.
If you like my content, you can subscribe to the news and receive my fresh ideas.
Thanks for being with me!


FROWeekly and 4 hour bullish divergence on macd. Hidden bullish divergence on daily macd. Impending price continuation to the upside on RSI.
