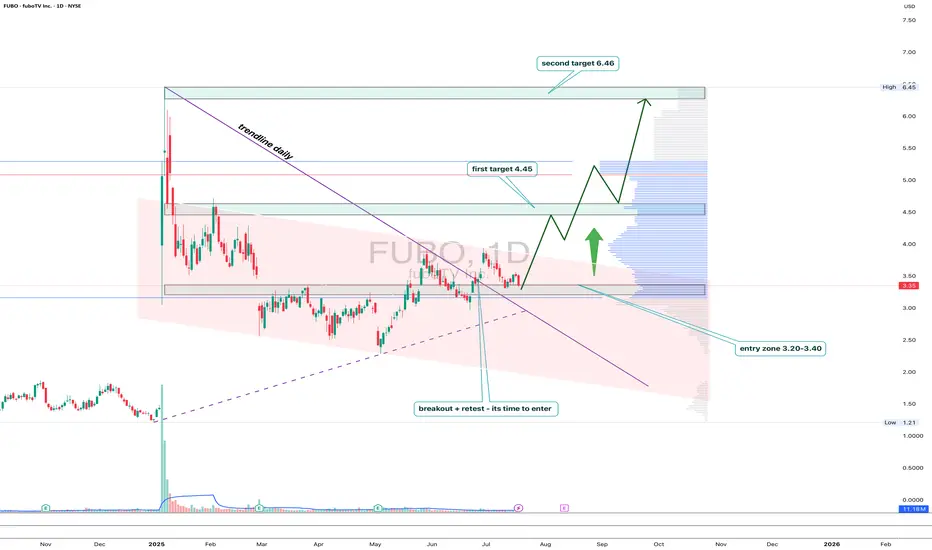
FUBO: trendline breakout with a subscription to $6.46FUBO has broken out of the descending trendline on the daily chart, followed by a clear retest and consolidation above the key 3.20–3.40 area. This zone coincides with the 0.5 Fibonacci retracement and high-volume support, confirming strong buyer interest.
As long as price holds above 3.20, the setup looks bullish with targets at 4.45 (0.382), 5.22, and finally 6.46 — the major resistance and top of the current range. Volume picked up on the breakout, validating accumulation from bigger players.
Fundamentally, FuboTV remains a niche contender in the sports streaming market. With optimized spending and new partnerships with major sports leagues, interest may spike ahead of events like the Olympics and NFL season.
Tactical setup:
— Entry zone: 3.20–3.40
— Must hold: above 3.20
— Targets: 4.45 / 5.22 / 6.46
— Invalidation: break below entry without buyer confirmation
This breakout might just be FUBO’s ticket to prime time.
FUBO trade ideas
fuboTV $5.00 price target Positive Divergence Multi time frameMy trade on fuboTV has a $5.00 price target. With positive divergence multiple time frames 15,1hr, 4hr. An RSI scoop where the hrly RSI with a length setting of 36 shows upward momentum? The Chande momentum oscillator with a setting of 24 indicates the price may not stall at $4.50.

Round 2 on $FUBO! 92% UpsideEarlier this year we caught the MASSIVE 400% move on NYSE:FUBO 🚀
1st PT is $4.89 🎯
2nd PT and MM of Falling Wedge is $5.86 📏
We've come full circle and we are back in them for another MASSIVE move!

FUBO: Long term investmentFUBO: Long term investment
.
Pull back and tight consolidation, preparing for a big jump.
US STOCKS- WALL STREET DREAM- LET'S THE MARKET SPEAK!

$FUBOThis looks like a promising stock for a deep dive. The streaming sector is also projected to be bullish in the coming weeks. If you missed out on gains with Netflix, Fubo might compensate you.

Not even a cable company have balls to charge 80 bucks a monthThe way I see it , not worthy to even for a position , just a quick scalp or two this month.
Lousy , very lousy business , loaded by garbage TV


Is FUBO going up from here? Got into FUBO on the pullback after it hit $5.46 in short order due to the court win over Disney. In at approx. $4. Since then it pulled back and then returned to the $4 line. Netflix revenue rocketed on news of their live events bringing in more subs. I think this is a good indicator for Disney and FUBO going forward. The notes on the chart are my own personal notes.
We shall see. Do your own DD and draw your own conclusions and let me know what you think.

Market Update - 1/26/2025• likely going to go into a consolidation / pullback within this rally soon
• 80% invested, with top 4 names being the largest, have 8 stocks which is a bit too high, looking to cut weak ones next week
• hopefully we get a strong day early next week to sell into
• not a long list of setups, likely because everything worth buying has already broken out -> won't be chasing the trend, not looking to buy new positions, it's about managing risk now
• this week I started doubling down on the stocks that were acting well, so far it's been working out nicely

FUBO Long Trade Setup !🚀 🔥
📈 Breakout Potential: FUBO is showing signs of a potential bullish reversal from a descending wedge.
📊 Key Levels:
Entry: $3.62 ✅
Stop Loss (SL): $3.34 🛡️
Target 1 (T1): $3.96 🎯
Target 2 (T2): $4.30 🚀
🔍 Volume Confirmation: Watch for increasing buying pressure to confirm the breakout.
💡 Opportunity: A strong long setup with favorable risk-reward and potential for upside movement. 💥
#FUBO #StockTrading #TradingView #LongTrade #BullishSetup #StockMarket #TechnicalAnalysis #ChartPatterns #MomentumTrading #SwingTrading #RiskManagement #ProfitableTrading #TrendReversal

FUBO Long Trade Setup: Bounce Opportunity! 🚀
Entry: Above $3.81 (Yellow Line), signaling a breakout from consolidation.
Stop Loss (SL): Below $3.72 (White Line) to limit downside risk.
Target 1 (T1): $3.93 (Red Line), the first resistance level.
Target 2 (T2): $4.08 (Green Line), the next resistance zone for extended gains.
Strategy:
Look for volume confirmation on the breakout. Adjust your stop loss to breakeven once T1 is reached. Monitor closely for any momentum shifts. 📊🚀

Major Price Movement Incoming for FUBO!Signalist has detected a precise pattern in NYSE:FUBO trading activity, signaling that a substantial price movement is imminent. This isn’t a random fluctuation—it’s a carefully analyzed precursor to a significant market event.
📅 What to Expect:
⌛ Timeline: Anticipate a major move within the next 1 to 4 upcoming 3-hour candles.
📈 Monitor the Charts: Keep an eye on FUBO’s price action over the next few candles.
Prepare Your Strategy: Whether you’re bullish or bearish, have your trading plan ready to capitalize on the move.

Disney Acquires Majority Stake in FuboTV to Form a New StreamingThe Walt Disney Company (DIS) will merge its Hulu + Live TV operations with FuboTV Inc. (FUBO), taking a 70% controlling stake. The combined entity will serve 6.2 million customers with an expected annual revenue of $6 billion, making it the second-largest online pay-TV provider in North America.
3 entry points, ABC trade
Trailing 1 runner

Flag pattern. Looks like could go up. But the open gap says down too. Could be one just to watch for entertainment.

$FUBO WHICH WAY WILL IT GO??I think the next stop for NYSE:FUBO is the 8$ area. If we break that area we are heading for 12$.

FUBO fuboTV My Top Stock Picks for 2023FUBO fuboTV is at 52 week low, oversold (RSI at 23).
Looking at the FUBO fuboTV options chain, I would buy the $2 strike price Calls with
2023-3-17 expiration date for about
$0.36 premium.
FUBO fuboTV is one of My Top Stock Picks for 2023!

FUBO possible price target based on recent Merge newsDisclaimer: on the fundamental side and based on many rough assumptions, not financial advice or any kind of advice, cannot guarantee accuracy, just for fun.
A. Combined Revenue Baseline
Starting (Year 1 Post-Close) Combined Revenue:
Let’s assume the newly merged Fubo + Hulu + Live TV starts with $2.0B of annualized revenue in 2025 (the first full year post-close).
Rationale: Fubo alone was on track for $1.3–$1.4B in 2023–2024 (annualizing trends), plus Hulu + Live TV with 4.4M subs could contribute $2– SEED_TVCODER77_ETHBTCDATA:3B on its own. However, some portion of Hulu + Live TV’s revenue might remain within Disney’s broader ecosystem, so let’s keep it conservative at $2.0B combined to start.
Revenue Growth Rates:
We assume synergy-driven marketing boosts sub growth and cross-selling lifts ARPU. We’ll start with a 25% top-line growth in 2026, then step down by a few points each year as the business matures that implies strong execution on synergy, cross-promotion, and relatively stable ARPU. If growth or ARPU lags, these numbers would be lower.
B. Cost Structure (COGS + Opex)
Cost of Goods Sold (COGS):
For virtual MVPDs, content/licensing fees are huge, often 70–90% of revenue. Let’s assume Fubo, pre-merger, was around 85–90% COGS as a percentage of revenue. With scaled synergy, maybe that drops gradually.
Operating Expenses (Excluding COGS):
This category includes marketing, G&A, R&D, etc. For a growth streamer, marketing is large, but synergy should yield savings. Let’s assume total opex (ex-COGS) is 15% of revenue in 2025, declining to around 12% by 2029 as scale efficiencies kick in.
2025: (100% – 82% – 15%) = 3% margin → $2.0B * 3% = $60M
2029: (100% – 76% – 12%) = 12% margin → $3.8B * 12% = $456M
C. Depreciation & Amortization, Capital Expenditures
D&A in streaming typically is modest relative to revenue, often 2–3%. We’ll use 2.5% of revenue.
Capex can also be low as a % of revenue (streaming is more about licensing, not building data centers). Let’s assume 3% of revenue on average.
D. Taxes & NOLs
Fubo (and combined entity) likely has significant Net Operating Losses (NOLs). Over this horizon, taxes may be minimal. For simplicity, assume an effective tax rate of 20% on positive pre-tax income, but note that NOLs might defer real cash taxes beyond 2029. We’ll do a partial tax assumption in the DCF to be conservative.
E. Working Capital
vMVPDs can have some favorable working-capital dynamics (subscriber payments in advance), but also large monthly payments for content. We assume working capital changes net out near zero over time.
F. Weighted Average Cost of Capital (WACC) & Terminal Value
WACC: Let’s assume 10%. This is fairly typical for a somewhat speculative media/tech company; actual WACC might range from 8–12% depending on capital structure, market risk appetite, interest rates, and beta.
Terminal Value: End of Year 2029, we assume the business grows at 3% perpetuity. We can use either a perpetuity growth approach or an EV/EBITDA exit multiple.
EV/EBITDA Multiple: If the market is confident in stable 12–15% EBITDA margins, it may assign ~8–10x EBITDA for a vMVPD. Let’s pick 9x.
With 2029 EBITDA of $456M, TV = $456M * 9 = $4.10B (un-discounted, at end of 2029).
The perpetuity approach and the 9x multiple approach might produce similar numbers. We’ll pick $4.10B as the terminal value for simplicity.
Projected Free Cash Flow & DCF
A. Calculating EBIT, Taxes, & FCF
EBIT = EBITDA – D&A.
EBT = EBIT – net interest expense (we’ll assume interest is modest if net debt remains manageable).
Tax = EBT * 20% (though real taxes could be postponed due to NOLs).
FCF = EBIT – Taxes + D&A – Capex – changes in working capital.
2025 is near breakeven, consistent with 3% EBITDA margin minus some capex. By 2029, FCF approaches $262M.
B. Terminal Value & Present Values
Terminal Value at the end of 2029 = $4.10B (based on 9x $456M EBITDA or a perpetuity approach).
So the total un-discounted value at end of 2029 = $262M (FCF in 2029) + $4.10B (terminal value) ≈ $4.36B.
Now we discount each year’s FCF + terminal value at 10%. So the present value of all future cash flows plus terminal value is about $2.69B.
Adjusting for Net Debt and Arriving at Equity Value
Net Debt
Let’s assume post-deal Fubo has roughly $400M in net debt. (It might be lower if they effectively use the $220M settlement to pay down obligations, but let’s be conservative.)
Equity Value
Enterprise Value (DCF) = $2.69B.
Equity Value = EV – Net Debt = $2.69B – $0.40B = $2.29B.
Shares Outstanding
We need to estimate the new share count. Fubo currently has ~300M shares, but Disney will own 70%, implying significant issuance. Let’s guess total diluted shares post-close around 500M (it could be 600M, 700M… depends on the final structure, conversions, etc.).
Implied Share Price
$2.29B equity / 500M shares = $4.58 per share (present value basis).
Sensitivity Analysis
A single set of assumptions can be misleading. Wall Street analysts usually build a sensitivity table around (1) WACC, (2) terminal multiple / growth, and (3) synergy levels.
A. Terminal Multiple vs. WACC
Below is a mini-table varying WACC (vertical) and the exit EV/EBITDA multiple (horizontal):
WACC \ EV/EBITDA 7x 8x 9x 10x 11x
9% $4.01 $4.58 $5.13 $5.68 $6.23
10% $3.29 $3.93 $4.58 $5.22 $5.87
11% $2.76 $3.35 $3.93 $4.52 $5.10
(Hypothetical share prices using 500M shares, and the same baseline synergy.)
If the business meets synergy targets and the market is optimistic, awarding 10x or 11x EBITDA at a 9–10% WACC, the share price might be $5–$6+.
If synergy disappoints (leading to 7x–8x multiple or higher WACC), fair value could be $2–$3 per share.
B. Revenue & Margin Upside
If the combined company outperforms, pushing EBITDA margins from 12% in 2029 to 15%, or if revenue grows faster (e.g., SEED_TVCODER77_ETHBTCDATA:4B + by 2029), the DCF would yield a higher equity value.
Conversely, if synergy fails and margins remain single-digit, the final share price would be lower.
5) Interpretation
Illustrative Fair Value Range:
Our base-case synergy scenario (9x terminal multiple, 10% WACC) suggests $4.58 per share.
With more optimistic assumptions (e.g., 15% margin, 10x multiple, slight NOL advantage on taxes, net debt below $300M, or fewer total shares), the model could push the fair value toward $7–$10+.
Under more pessimistic assumptions (less synergy, 7x multiple, 11% WACC, or 600M+ shares), it could fall to $2–$3.
Comparing to Market Price Movements:
The stock jumped from $1.44 to around $6 on the deal announcement—a big gap from the DCF “$4.58” scenario. This often happens in M&A contexts due to immediate speculation, short covering, hype, or the possibility that synergy is bigger than the market initially expected.
Key Drivers:
Synergy: If the combined vMVPD truly drives content-cost savings and robust subscriber growth, margins will expand quickly.
Regulatory Outcome: If the deal is delayed or blocked, this entire synergy story could unravel.
Share Count: The single biggest wild card is how many shares exist post-close. If it’s 700M instead of 500M, that alone reduces the per-share price by ~30%.
Capital Structure: If Fubo uses the $220M settlement to retire more debt, net debt might be only $200M, improving equity value.
Conclusion & Takeaways
This “far more detailed” DCF approach illustrates how professional analysts might try to triangulate a fair value for Fubo after the Hulu + Live TV combination, incorporating synergy-driven margin expansion. The result is not a single price, but a range based on multiple scenarios:
Base-Case (in this illustrative model): around $4–$5 per share.
Upside (strong synergy, favorable market multiples, fewer shares, quicker margin expansion): $7–$10+.
Downside (weak synergy, higher WACC, more shares, persistent losses): $2–$3.
The exact share price depends heavily on:
Actual synergy: content cost reductions, ad revenue growth, etc.
Subscriber churn and ARPU trajectory.
Regulatory constraints on the combined entity.
Final capital structure (net debt) and total share count post-transaction.
Broad market conditions for streaming/tech stocks (risk appetite, interest rates).

Daily Halftime Report: FUBO - Long PlayFUBO broke out to $4.99 this morning after announcing an agreement to combine their Online Live TV Businesses, creating a new venture with the merge that would position Disney with 70% Ownership | Fubo with the remaining 30%. This will prompt FuboTV to drop it's legal claims against Disney also. I'm looking for a potential entry at $3.69 after seeing it peak at $4.99, with a price target of $8.14 over time until the merger is completed, with confirmation of close above $3.81 on the stock.
MT-Newswire:
08:31 AM EST, 01/06/2025 (MT Newswires) -- Walt Disney (DIS) and streaming provider FuboTV (FUBO) are nearing an agreement to combine their online live TV businesses, Bloomberg reported Monday, citing sources familiar with the discussions.
Under the deal, Disney will merge its Hulu + Live TV business into Fubo, creating a new venture that would be 70% owned by Disney and 30% by Fubo, Bloomberg reported.
The transaction excludes Hulu's subscription video-on-demand business, which allows users to stream content on-demand for a fee, the report said
As part of the deal, Fubo is expected to drop its legal claims against Disney, Fox (FOX), and Warner Bros. Discovery (WBD) over Venu Sports, Bloomberg said.
Fubo, which had a market value of about $481 million as of Friday, will remain publicly traded after the deal, which could be announced as soon as this week, according to the report.
Representatives for Disney and Fubo didn't immediately respond to MT Newswires' requests for comment.
FuboTV shares soared by more than 60% in premarket trading, while Disney was little changed.

When uptrend speaks a thousand words +245% ($1.44 - $4.98) $FUBOHave you seen anything more beautiful in 2025 so far? Except a female...
When uptrend speaks a thousand words +245% from $1.44 to $4.98 with 2 Buy Alerts along the way NYSE:FUBO

FUBO | Another Runner in the Making | LONGfuboTV, Inc. engages in providing subscription to sports, news, and entertainment content. It offers its services through streaming devices and on television, mobile phones, tablets, and computers. The company was founded by David Gandler, Alberto Horihuela Suarez, and Sung Ho Choi on February 20, 2009 and is headquartered in New York, NY.

Is FUBO setting up for a MASSIVE MOVE UP? 65% UpsideCharturday #1: NYSE:FUBO 📺
Weekly Chart:
-H5 Indicator is GREEN
-Wr% trending up from bottoms
-Sitting on Volume Shelf
-Triangle Pattern x2 - Need to breakout...again
Daily Chart:
-Triple Bottom with a liquidity grab below 3rd bottom
-At volume shelf
-At bottom of Wr% and swinging higher
-Need to swing back up to $1.90 breakout area
Targets if we breakout of any of the patterns:
🎯$2.17🎯$2.36🎯$2.52🎯$2.82
I'm in this trade and holding on due to the H5 indicator staying GREEN on the weekly. If you aren't in this trade it's not one worth entering until we have a breakout.
Not financial advice.

$FUBO UPDATE! We may be primed for a BIG BOUNCE! NYSE:FUBO
-Staying patient and believe we may now be going for a triple bottom before we have our large move to the upside as you see on the daily chart below.
-Weekly H5 indicator is still GREEN
-We are also on the floor and green bounce area on the williams r%! Which to this point you've see what happens when we get there
-I'm not concerned because we haven't started moving big on the IWM yet and until then most small caps won't move unless they have a catalyst.

LONG FUBOFUBO was on a run FROM $1.20 TO $2.18. Went back down to 78.6% retracement. Created a local double bottom at the area where resistance is regarded as support. Low risk area with great upside potential
Buy at $1.80
Stop loss 1.34
Take profit 1: 1.79
2: 2.10
