GE trade ideas


GE: still somewhat bullishI realllly like the levels alot.. hitting the golden ratio...... what worries me is the MACD.. with no momentum to push up?

GENERAL ELECTRIC D1General Electric is a large corporation engaged in the production of heavy equipment and the military industry. The company also manufactures products from different materials. In times of instability, devastation and conflict, their products can be very relevant. There are serious unrest in the world due to the situation with the coronavirus. The crisis that has overtaken the violence of the entire planet due to quarantine creates huge problems. Also, in many countries of the world there are election campaigns that are particularly violent and create conflicts. One gets the impression that provocations and revolutions are very beneficial for someone. There is a version that bankers make the largest profits precisely in times of instability, disaster, war and epidemics. This is exactly what we see around the world today. In this environment, General Electric has a good sales market. And its products can be very necessary for structures that deal with these events.

GE is looking very hopeful for the week of Aug 17thNYSE:GE GE is at the buy out price. This is what I see for the week of Aug17th


A war is brewing in GE and the battle lines have been drawn.Fundamentals:
Market Cap 57.66B
Income 3.34B
Sales 87.87B
P/E 17.48
P/FCF 27.75
EPS this Y +99.8%
Institutions hold 61.98
Annual Dividend of $0.04
Short float of 1.01%
Bearish Fundamentals:
Insider Transactions -73.5%
Insiders Own 0.13%
Institution Transactions over the past 3 Months -0.7%
ROE -16.3%
Profit Margin -5.8%
Debt/Eq 2.43 (shockingly high)
EPS past 5Y -14.9%
EPS Q/Q -663.8%
Sales Q/Q -24.2%
Technical Analysis Comments:
A potential inverted H&S within a potential bearish channel.
GE traders clearly paying attention to the pivots & confirming the battle grounds of Support 1 & Resistance 1.
Good luck trading!

Case for the medium termSo if I were to make a "case for the medium term" it would be that if the cup and handle on the hourly would follow through with a dollar raise. Then the SARs on the weekly would flip bullish triggering longer-term traders. "I'm just guessing ~ my disclaimer ~ my TA stinks."

Small Cup & handle forming on the one hour chartIt's a bit premature however there seems to be "Small Cup & handle forming on the one hour chart".
Uncertain about any more upside potential. I think there's a medium or perhaps even a long term case to be made however that's not yet reflexed in the charts.


Bullish Reversal Patterns in General Electric As anticipated last week, sentiment has pivoted sharply toward cyclical reopening stocks like small caps and industrials. Meanwhile the Nasdaq has struggled.
Now one of the most iconic industrial stocks of all has some potentially bullish reversal patterns: General Electric.
GE has lost more than three-quarters of its value since the end of 2016. Its troubles have been well documented and discussed in the news and analyst reports.
However, the chart may show some long-term reversal patterns.
First, GE slightly undercut but held its March 2009 low of $5.51 in May. Holding an 11-year level like that can be important.
Second, we see the May low of $5.48 flanked on either side by higher lows of $5.90 in March and $6 on July 31. That’s a potential inverse head & shoulders pattern.
Finally, GE had a bullish outside candle on Friday, August 7, another potentially bullish signal.
This comes at a time when the SPDR Industrial Fund is up 6.4% in the last five sessions, while the Nasdaq is up less than 0.5%.
That kind of relative strength, plus the chart patterns, could focus attention on GE on in coming sessions.

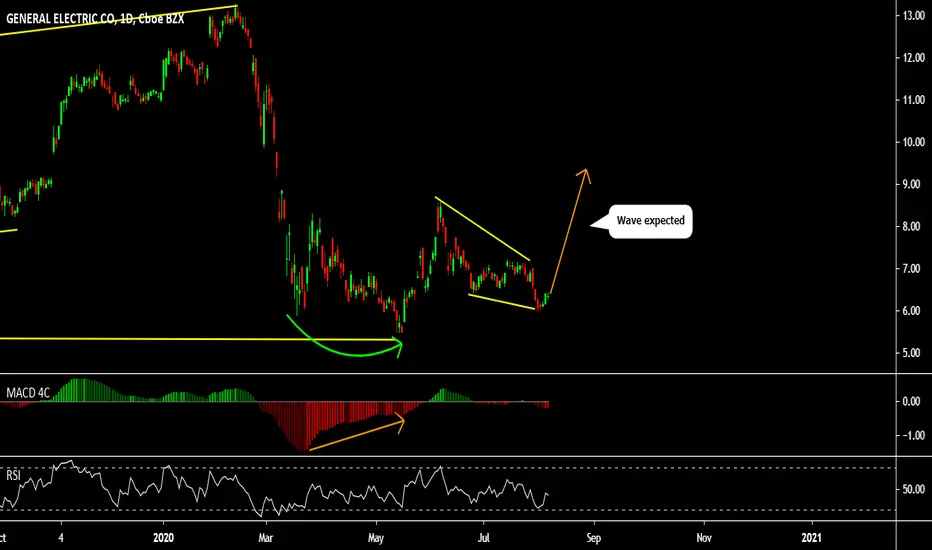
GE in an interesting price zoneH&S forming + horizontal trendline which goes back to 2009 - all signs for me to keep an eye on GE for the next couple of days or even weeks.
Price action at the neckline of the H&S will determine either to stick with the trade or even reverse and go short.
Trade with care!

GE BUY (GENERAL ELECTRIC CO)Hi there. Price is forming a continuation pattern to the upside. Watch strong price action at the current levels for buy.

GE Bear FlagWatch for GE to make a move to retest the lows around $5.50 a share. GE has found temporary support at $6.00 and is forming a bear flag pattern. The hour chart on the right shows respect of the minor trendline of the flag. Look for a break in the trendline before going short.
GE had a wide miss on earnings last week, driving share prices down on heavy selling volume. This current rally is occurring on very light volume, contrary to what we should be seeing on a reversal. COVID-19 will continue to affect GE's retail and aerospace sectors, with engine demand way down.
Short position should be re-evaluated at the lows around $5.50. A break above resistance in the $6.50 zone should invalidate this idea.
This is an idea only, and should not be considered investment advice. Trade according to your own rules and risk tolerance.

GE is a solid setup for a move to $7.10. Volume pouring in.Still over sold and big volume coming in here today

GE STAYING LONGI know from my last GE post we failed but It still looks likt it will go long especially with some investment in Australia for hydro power
