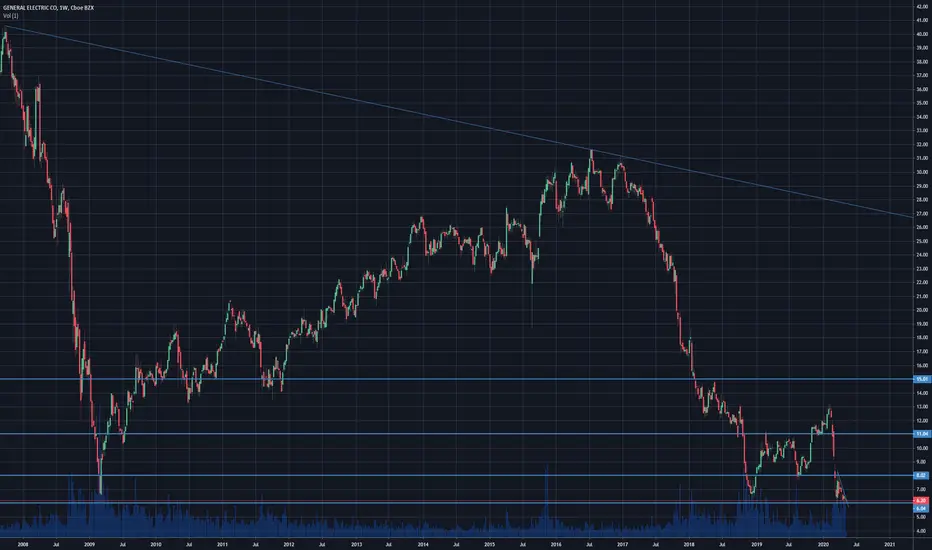
General Electric - GE Technical AnalysisGeneral Electric prices might start to go up. Before buying wait that the support will be broken. Longby MaurielloUpdated 8
GoNoGo Trend change for GE?Is the tide turning for GE? For the first time since February 26th the GoNoGo Trend indicator is unable to paint a bearish color instead showing the amber neutral of “No Trend”. This color change has happened on a gap and above prior highs. The GoNoGo Oscillator hinted at this change as it broke above zero for the first time since mid February one bar earlier. This new positive momentum could lead to a “Go” in the price chart and a test of the prior highs around 8 dollarsLongby GoNoGoCharts2214
OPENING: GE SEPTEMBER/JULY 6/7/8 COVERED ZEBRAOver the weekend, I did a post on "Zero Extrinsic Back Ratios" or "Zebras," (See Post Below), and am resetting a trade I got a smidge too impatient and/or aggressive with in GE to show how this setup works in practice with a minor twist: I'm covering it with an extra short call. Metrics: Max Loss: 1.96/contract Max Profit: 3.00/contract (the width of the 6/7 or 1.00 plus the width of the 6/8 or 2.00) Break Even vs. Spot: 6.98 vs. 6.86 (total debit paid (1.96) divided by the number of longs (2) or .98 plus the long call strike (6.00) or 6.98) Delta/Theta: 72/.10 Notes: In my Brazilian Zebra Post, I indicated that a straight Zebra should be looked at in parts: (a) a standalone, in-the-money long; and (b) a long call vertical. Assuming favorable movement, the long call vertical would be taken off at or near max, after which the long call could be allowed to ride. Alternatively, the short call is rolled out for further credit and cost basis reduction, with the take profit reduced by the amount of credit received (e.g., if max is 2.00 and the credit received on roll is .20, the new take profit target is 1.80). Here, I'm twisting that setup slightly by covering what would have been the stand alone long with an additional short call so that -- in essence, I've got two long call diagonals in place: a September/July 6/7 with a max of 1.00 and at September/July 6/8 with a max of 2.00. The goal: to take profit on the 6/7 at or near max and the 6/8 at or near max. Otherwise, I'll just roll the short calls out to reduce cost basis further. An additional variation would involve laddering the short calls out in time by strike and duration: September 2 x 6 long call/July 7 short call/August 8 short call.Longby NaughtyPinesUpdated 6
GE STOC, BUY WHEN THERE IS BLOOD ON THE STREETS!Hello traders and investors, Baron Rothschild, an 18th-century British nobleman and member of the Rothschild banking family, is credited with saying that "the time to buy is when there's blood in the streets." The question here is who is actually have the mentality and the strength to go against the majority. Why am i saying all these? Ok let's see the GE stock. Fundamental analysis: On key earnings and sales metrics, GE stock earns a solid EPS. General Electric EPS for the quarter ending March 31, 2020 was $0.70, a 75% increase year-over-year. General Electric EPS for the twelve months ending March 31, 2020 was $-0.32, a 84.62% decline year-over-year. The EPS Rating shows a company's health on fundamental earnings, and its SMR Rating reflects sales growth. Revenue is seen shrinking 24% to $20.8 billion. Analysts on average expect GE earnings per share to decline 34% to 43 cents in 2020, then to rebound 52% to 65 cents in 2021. GE posted total revenue of $20.524 billion, which represents a year-over-year decline of 8%. On an adjusted per-share basis, the company earned 5 cents. “The second quarter will be the first full quarter with pressure from COVID-19, and GE expects that its financial results will decline sequentially,” GE said. As global travel screeched to a halt, General Electric’s aviation business saw revenue fall by 13% to $6.892 billion on a year-over-year basis in the quarter, with profit in the division tumbling 39% to $1.005 billion from $1.66 billion. Orders declined by 14%. The company’s power and renewable energy businesses also saw revenues decline in the quarter. The company announced earlier this month that it was withdrawing its 2020 forecast. The company also said its cash and cash-equivalent holdings topped more than $47 billion along with a revolving debt facility of $15 billion to ride out the virus-induced downturn. Technical analysis: 1.We have 5 Elliott waves completed on the weekly chart to the downside. 2.BIG Bullish divergence on the daily chart. 3.Descending triangle on the monthly chart plus DOUBLE BOTTOM WITH BULLISH DIVERGENCE on the monthly! Possible long trade: ENTRY AT 6-6.5$ AREA STOP LOSS BELOW THE LOWS AT 4.5 AREA FIRST TARGET AT 9.5$ AREA SECOND TARGET AT 18-20$ AREA RISK/REWARD RATIO AT 5,44 AT LEAST! THANK YOU FOR YOUR TIME HAPPY TO HELP THE GREEK TRADERby The_Greek_TraderUpdated 131310
$GE - General Electric Mean ReversionGeneral Electric Ticker: GE Industry: Industrial Entry: $6.44 Stop Loss: $5.47 Price Target: $9.00 Notes: Mean Reversion Trade, Failed breakdown of the Dec. ‘18 lows w/ bullish RSI divergence Risk: $0.97 Reward: $2.56 Reward/Risk Ratio: 2.64Longby PatrickDunuwila7
GE - BreakoutRecently broke out of descending triangle with MASSIVE institutionalized buying the morning of May 18th. Levels posted with 8.23 being my main target.Longby thealecbellamy667
Monthly Bullish DivergenceThe monthly chart shows a bullish RSI divergence, a long term buy signal. Longby LearnTradeLive10
let go ge get your turbines burning manfire up them burners... Follow Follow FollowShortby BlockchainYahoo446
strong move!Pretty strong move by GE lifting over 50 & 200 SMA on the hourly with a gap up. Will it see a continued recovery in price? It is now or never. I would be bullish if it can successfully test this breakout. Shortby frodo754
General Electric - Long Trade Pending Further upside expected after Capitulation and depleted supply ....... I will use a simplistic method of Wave Analysis as waves are subjective. However, price levels will be used as a countermeasure to offer objectivity in an attempt to keep the right side of the market Long02:07by Reward2Risk0
RSI at extreme oversoldRSI at extreme oversold, triple bottom. good to buy at market, good to buy at market with TP @ 10.00Longby ClearWaterTradingUpdated 114
GENERAL ELECTRIC ($GE): ...but All We See is Negative Currency✨ Drop a comment asking for an update, we do NEW setups every day! ✨ Like, Comment & Follow to help the community grow 🎉🎉 --- General Electric's chart looked bearish before COVID, and it still looks bad now. GE has some interesting stuff going on, its bouncing off its 29 year low, it put in a bid to re-engine a B-52 fleet. Lots of reasons why things could start looking up for GE, but for now it makes sense to play the trend. We are running up to some resistance here after a little rebound, and with that we are looking to enter short. Resource: seekingalpha.com --- 1. Fractal Trend is showing a downtrend (Maroon bar color) on the 1 hour timeframe as GE continues its low downward spiral. 2. With this strategy, we are looking for short setups in a downtrend and as such want to enter short on retests of bearish order blocks plotted by Orderblock Mapping (Maroon line color) and/or bearish S/R levels plotted by Directional Bias (Maroon line color). 3. Right now we are looking for a short entry off the range fromed by the previous S/R flip and bearish orderblock at R1. 4. Our stoploss is placed above the orderblock to protect capital if for example the markets manage to run tomorrow or some bullish GE news comes out. Otherwise our target is the S1 S/R flip. The only note here is that we are going to want to see how the market opens before rushing to short this. All the major indexes are at resistance right now (see the related ideas below). If the indexes can break resistance, or if some good GE news comes out, then we want to hold off shorting this and eye some higher levels like the R2 Orderblock + S/R flip cluster. Good luck fam!by AlphaBotSystem12
General Electric Technical Analysis - HOLDThe Market is still moving in a sideways trend, no a lot of signal of buying/selling from both Technical and Fundamental analysis, so the better option seems to hold.by Mauriello119
GE - Potential Wave 5 in progressPotential E.Wave 5 in progress EMA indicators all +ve Potential target reaching $14 Note: This is not financial or investment advise. It will be good to always understand the risks involve in trading. Always trade with stop Loss in place. If you like the analysis, please give a thumbs up (at the bottom of the chart). Thank you.Longby SmartisUpdated 10
$GE long opportunity but entry near by 4.4 With goal at 8.8Recently broke the bottom and falling further but could be nice long opportunity if it can bounce from 4.5-4.4 with good volume which will open the gate for bull wave targeting 100% revenue to area of 8.8 Longby WinnerTrader99Updated 118
GE BULL RUN | Bounce Off Monthly LevelGood afternoon Traders, Today we made a few weekly GE plays playing the continuation. Plays Made: - $6.5 Call 5/22 and 5/29 Looking to grab much longer-term contracts ASAP. Potential Plays: - 6 Month Play | GE $10 Call 9/18 @ $10 Per Contract - [Far out the money ] 6 Month Play | GE $19 CALL 11/20 @ $3 Per Contract Do not trade this, not financial advice DotcomJackLongby DotcomJack2212
$GE at resistance on 2HR chart short termStill holding June 8P 1/3. watching for a break over this area to close rest of position otherwise hold for the next move down. over 6.60 bullish short term, under 6.20 is back to your regular scheduled program. $DIA by Veets115
OPENING: GE OCTOBER/JUNE 4/7 LONG CALL DIAGONAL... for a 2.38/contract debit. Metrics: Max Loss: $238/contract Max Profit: $62/contract Return on Capital at Max: 26.05% Break Even: 6.38 versus 6.95 Spot Debit Paid/Spread Width Ratio: 79.3% Notes: Another small, bullish assumption engagement play while I wait for April opex.Longby NaughtyPinesUpdated 116