COULD GOLD BREACKING RED TRENDLINE ?!it looks like gold has a solid buying zone with an interesting rising channel structure. What do you think of a bullish move and a potential breakout of the red trendline?
GOLD trade ideas

Silver is at $24.15 resistence. Gold is at $1841 Gold and silverSilver is at $24.15 resistance. Gold is at $1841
Gold and silver advanced seriously this morning at around 9am 1-19-2022. Silver is at $24.15 resistance. Gold is at $1841. AG is up 12% today this morning. GOLD is up 7-8%

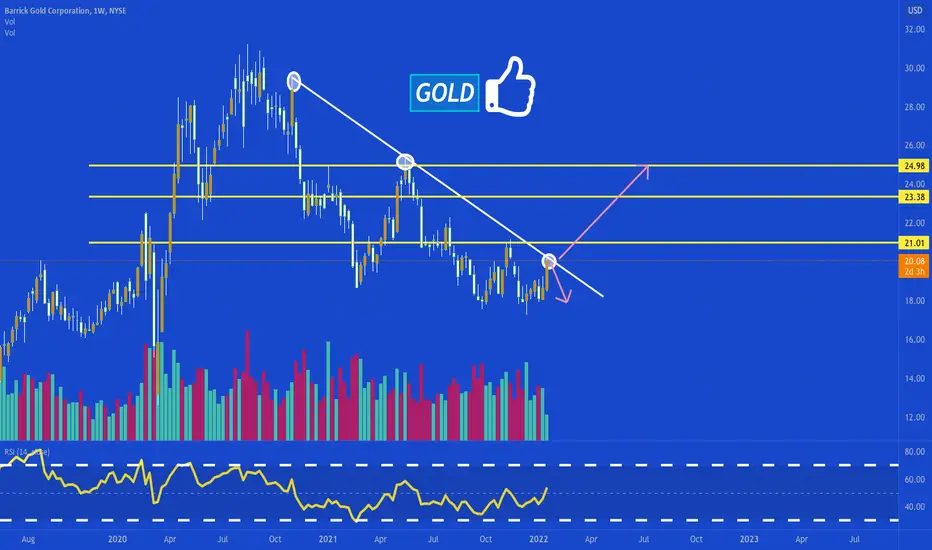
lets see if it can finally break 🧐gold approaching this trendline resistance again, puts can pay if we see another rejection.
targets 21.01-23.38-24.98 if we finally break it! like and follow for more 💘
Barrick Gold Demand and Supply analysisTwo alerts placed for options exits. Overall this stock provides the risk and reward ratio for some profit 3:1. Analysis drawn Chart

Over 19.10, and GOLD Could Fill the 20.25 Gap.Barrick Gold has failed a bunch of times at 19.10. If it can close above that level, it could get to 20.25.

BARRICK GOLD - Setting up for REVERSAL.Look out for entry between $16.5 - $17.5.
Potential upside ~$13 or ~70%
Forming Megaphone pattern from strategic stand point so can go even higher then $31.

Expect Over 80% Profit From Barrick Gold SharesBarrick Gold making triple bottom already showing signs to commence a rally up...
N.B
- Let emotions and sentiments work for you
-ALWAYS Use Proper Risk Management In Your Trades

Hedge against InflationThe Barrick Gold Corp. is a great diversification for your portfolio in times of uncertainty as investing in Gold should always be your go to choice whenever a hedge against inflation is necessary.
Barrick Gold is mining it's precious metal all around the globe, aswell as it is trying to help society with charitable organisations.
For sure a rock solid company, worth 10% of your overall portfolio.

2021 Year end cryto-BTC, ETH, Gold and Silver AG and GOLDOverall, BTC and ETH are going downtrend: it is bearish in the coming 4-5 months.
The same thing may be true for precious metals, gold and silver, the miner stocks I picked are AG and GOLD. Although the fundamental is good, they may go down in the next 4 months then go up.

GOLDIf there is still an attempt to buy off the strait. I believe in general in the possible growth from the triangle

Inflation and a variant is hereAlong with the new variant and factor inflation in. This is a good buy on the pullback to support.

Barrick Gold - Inverse Head and Shoulder Pattern Barrick Gold formed Inverse Head and Shoulder Pattern, and break out today. It might go lower a little bit and test the trend line in next few days or weeks. Eventually it's going to raise to $22.5 and test the strong resistance. Long term very bullish, target $60 by 2023.

GOLD is finally gaining some momentum💸congrats if you added on the bottom trendline dip entry!
gold is now approaching its huge top trendline resistance, I expect it to break it and continue the rally to 26+ in 2022.
goodluck, like and follow for more 💘

Long term Gold mining stock accumulation planSo on Gold stocks we are definitely gonna profit from inflation. But there are several factors which influence the amount of time and price range we can accumulate over.
1 short term scenario we bounce now
2 mid range we go down to 15$
3 longer term shit because fed pulls of a rate hike = 5$ entry when we reach the lowest depression.
Lets see what goes down.


Barrick Gold falling wedge & supported by mid-term trend lineMacro environment:
With Fed continuing to print money, inflation is no longer transitory.
Without a clear timeline for taper, gold will present opportunities for hedge.
Even if interest rates are raised, market turmoil should also be good for safe havens like gold
Technical Analysis:
Previous 2x Falling wedges resulted in a price rebound within the trend channel and this 3rd falling wedge should not be any different.
Long term, GOLD is also on an uptrend, i see very little downside.

BARRICK @ supportBarrick showing buyers @ support
trend line. buy this trend line support
keep it simple

EW view on Barrick Golddhvskdjvbskdjvbskjvbslkjdfbvsdlfjvbdfljbvdslfjvbdsljfvbdsljvbsdjvhblvjhajlvbsdljfvbkdjbvdf
trade responsibly

My JB MA CHANNEL INDICATORWe all know that moving averages, in particular, moving averages of closing prices tend to be highly inaccurate indicators and frequently miss major tops and bottoms. In backtesting, they tend to be accurate some 30 to 40% of the time which is to my way of thinking unacceptable. On the contrary moving averages of opens versus closes for highs versus lows, when used properly avoid the drawbacks of closing moving averages, particularly when combined with a trigger. Shown above is my moving average channel method which uses the 57 SMA of Williams accumulation distribution as a setup or trigger. As shown by the arrows two consecutive price bars completely below the MA channel low and triggered by Williams below SMA constitutes a sell signal. Conversely, two consecutive price bars or more above the moving average channel high accompanied by Williams above its moving average constitutes a sell trigger. The moving average channel high, the red line is a 10 period Moving average of highs. The Moving average channel low, the green line is an 8 period Moving average of the low. There are at least a dozen applications of this methodology including its ability to spot trend changes, support, resistance, swing trades, market strength, market weakness, and more. I will post some of these additional uses of the moving average channel as they present themselves. Do note that in this chart there were two instances above the moving average channel high but these were not triggered by Williams AD and therefore the trend remains down for the duration of this chart. The methodology associated with my MAC is completely rules-based and works in any timeframe. Thank you my friend Larry Williams for developing your excellent version of accumulation distribution. Thank you Dan Wall here on TV for your brilliant coding of my work.
Jake Bernstein (RBT rules-based trader)
www.jakebernstein.com
PS to see the MAC in a bull market take a look at a daily chart of Netflix (NFLX)

Barrick Gold: Scary! 🎃🎃🎃Though the price has recovered a bit, we are still far away from announcing the end of the correction. In contrary, there is plenty of room left on the downside. In total, we expect the course to drop below $13.01.
Down, Down!

American Barrick (Gold:NYSE) ....(My Game Plan)
I am looking at a American Barrick (GOLD) purchase opportunity on weakness at slightly lower levels.
My trigger level is a PRZ (Price Reversal Zone) from approx $16.90 to $15.90 which would satisfy the completion of a bearish Crab pattern and the initiation of the final leg of Cypher pattern whose price objectiveiisi around the $27 level.
If things fully work out, and they rarely all do, this idea thus carries a 10:1 reward ratio.
Now you have to like gold in general and gold shares in particular to even consider this trade.
Barrick's price momentum seems extended and subject to weakness.
Barrick recently increased their dividend and one should expect more as major gold companies are experiencing major free cash flow surpluses.
2 points to consider in the shorter term:
1) We have a small gap above here which may be filled and
2)the completion of an ABCD leg may draw in some bottom feeders.
If we take out the dotted blue line I may have to reevaluate my thinking.
This is a 4 hour chart.
Watch the broad market, the Gold price and the GDX for further directional clues.
As always this is not investment advice and do your own due diligence on any positions.
We are coming into a period of characteristically rapid turmoil so don't be married to any position or view and be nimble.
If in doubt... stand aside !!
Good Luck
S.


