TrendyTrades: HD Bullish AnalysisIf we can hold and close above 319.80, we should be able to see a push back up with a gap fill.
HD trade ideas

HD Long OpportunityHD has strong fundamentals & has just begun an uptrend. Set a stop loss at the indicated line when opening the position. On breakout of resistance line go to trailing stop loss.
Roughly 2:1 risk to reward ratio.
HD is sensitive to moves in SPY which has been tempermental lately so keep that in mind as you trade.


HD ShortPossible Double top
Earning 8/17/2021
Short 334
Stop 347
Target 280
Risk management is much more important than a good entry point.
The max Risk of each plan should be less than 1% of an account.
I am not a PRO trader. I trade option to test my trading plan with small cost.

HD Short Term WeaknessWeakness showing in HD. The resistance (in blue) is proving to be just that. The MACD has turned, showing just a bit of bearish divergence as well. A solid engulfing daily candle showed on Friday the 6th of Aug 2021, which led to a bearish pin bar setup. The 100 daily EMA has proven to be a zone to pay attention to over the past 10-15 years and will look for strength if price approaches. Slightly lower we can see where rough support is (pink). This area around the 100 daily EMA and pink support is where my T1 sits. If further break down occurs past the daily 100 EMA, then I'll look at the 200 daily EMA weekly, which has proven over the past two years to be a quality buying area.

Short $HD Technical SetupShort $HD Technical Setup
Broke out or rising wedge
0.88 Resistance
Target 315$


HD - modest idea but quick Numerous traps but the last the most crucial, chances are to keep on , marching higher, it should be quick or fade.


Home Depot - an intriguing weekly chart - 328.50 resistanceThis chart follows a swing put trade idea I posted in early July (linked). I bought and sold those puts when price dropped from 322 to 318. Now I want to share this channel I found on the weekly chart, and I am wondering if the Feb. - Mar. 2020 price action will occur again? I like HD for day trades and short term swings. I prefer to keep a smaller position size so even if price moves against my option I have time and comfort to hold a loss .
On a candle chart you can draw a horizontal line at 328.50 and see this area, reached on 21 July, is resistance.
Below the two channel lines is a lower support line that provides a downside target.
Remember this is a weekly chart so look for trade entry signals like candle setups and RSI on daily/hourly timeframes.

$HD - Inverse head & shoulder - Target $340Playing out inverse head & shoulder. Break above the neckline bullish. Break below the neck line bearish.
Neckline - $321 - $322
Entry - $325
Stop loss - $313
Target - $340
———————————————————
How to read my charts?
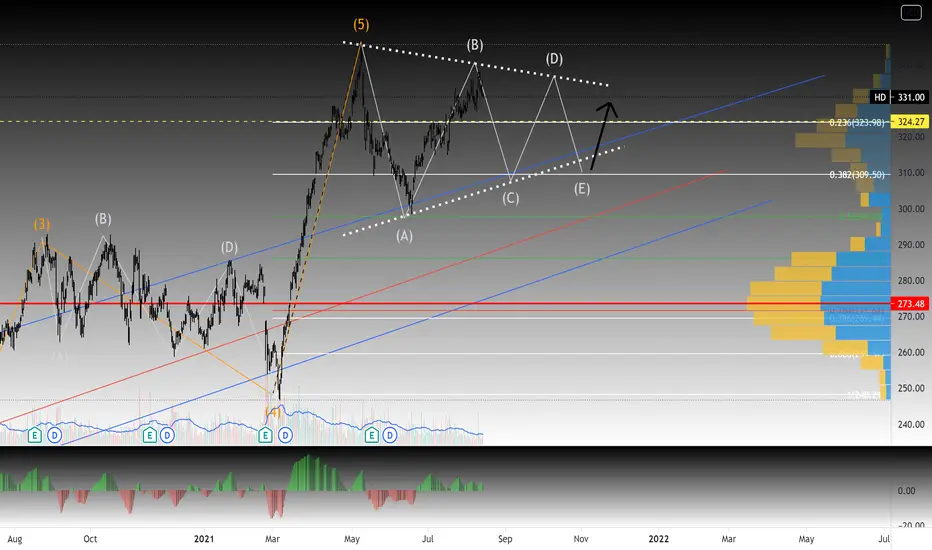
- Matching color trend lines shows the pattern. Sometimes a chart can have multiple patterns. Each pattern will have matching color trend lines.
- The yellow horizontal lines shows support and resistance areas.
- Fib lines also shows support and resistance areas.
- The dotted white lines shows price projection for breakout or breakdown target.
Disclaimer: Do your own DD. Not an investment advice.

Bullish- Triangle breakoutWatching HD closely here- Strong relative strength yesterday, looking for a breakout at the end of this triangle
- MACD cross
- EMA's starting to curl (not pictured)
- Symmetrical Triangle forming with buyer volume stepping in
- Bollinger Bands are Squeezing
PT1- 321.50$
PT2- 323.48$
PT3- 325.00$

HD - on watch for a breakout-Inverse head and shoulders
-Breakout level @ 324.50
-4hr gap @ 341.13-338.15
-Look for the 50DAY SMA to act as
support
-Wait for confirmation. Would love for
it to get above the 6 & 8 SMA or
form a squeeze on smaller timeframes.
NYSE:HD

$HD Chart IdeasWe just saw $WMT break out today on the same pattern that we could see $HD follow in the coming days. It gapped up then formed a desc. triangle in which it filled the gap and bounced off the support. I'll be watching it closely for potential breakout to the upside then bullish trend channel.

HD - swing puts againThis chart follows up on my earlier post (linked). I bought swing puts and while price pushed over 322 I was able to hold my puts due to time, and small position size. I sold them for profit on 8 Jul when price was around 318. Here I see another opportunity for swing puts, based on RSI.
On the daily chart, left, RSI dipped below 33.33 and then bounced up, but has not moved over 66.66 even with the bullish candle on 7 Jul. In fact there was a bearish open on the 8th. These past two days show price stalling, possibly reversing back to 310, and the gap near 304.
On the 30m chart, last week there were two candles that kept RSI below 30. Today's big opening candle was bullish but could not get follow through and RSI is also under 66.66. I see price heading back to 321 and then then gap fill near 318.80.

HD Triple Support Convergence1. Home Depot is nearing three distinct support indicators that converge at the 290.00-300.00 range. The 200 EMA, trend line from October 2019, and trend line from March 2020 all meet within the 290.00-300.00 range. Price currently sits above this range, and tested 300.00 in the previous few months. The three supports in this range should serve as a launch point for price, and price can retest the support before more upside.
2. The lower end of the support zone (290.00) was a notable resistance point on two different occasions during October 2020. Now it acts as a strong support, and price should hold on to this level with much strength. It is a good confirmation to the other trend lines.
3. Relative strength index shows a repeated pattern that has been followed by significant upside on two recent occasions. For RSI to reform this pattern, price needs to pull back to the support level and consolidate. After a confirmation of the support level and a reset of RSI, shares can move decisively to upside.


HD - start with new Bullish sign Date: 05 -09 July21
Monthly: Hammer with strong bullish rejection
Weekly: Bullish breakout R 320.57
Daily: Friday - small doji closed slightly above R 321.91
MA: Red / Blue
Volume: Low and moderate bullish volume
STO: Above overbought
Summary:
If the price remains above R 321.91, the price is looking to reach next R 328.51

House fixing and furnishing is done - HD swing putsHomes were renovated, appliances were upgraded, and new homes were furnished. This does not happen annually. I am looking for HD and other related stocks to cool off. This 321 area is a good place to enter swing puts.
The 14-day RSI shows a dip below 33.33 (yellow circle), which means I am looking for this move up to stall soon (RSI pink circle) and turn down. Stochastic is also elevated and I am looking for it to also turn down. If price wants to go higher, then these indicators could stay elevated, but I will stop out with a small loss.

HD Swing HD has sold off from previous run.
Found support and bounced after strong consistent down move.
Playing fibonacci here and looking to fill gap to 320 into 322/325/330+
7/19 320Cs
AIM : 322-325 WITH MOMENTUM
STOP LOSS 15-20% OF PREM.
CURRENT OPTION PRICE ON 320 C (0.84/CONTRACT)

HD consolidating$HD is making a nice inside candle so far today and resting on the 20 dMA after pushing through it yesterday.

HD headed back to $340. Bull Flag Breakout Greetings All,
Classic bullish flag breakout on HD! Target acquired.
Happy Trading!
