HD trade ideas

HD puts, unless stock goes over 192.80On the weekly chart, you see a bullish engulfing candle, technically that signal triggers when the high is broken. This week the high is 192.80, same as last week. Stock has to trade at 192.81 or higher for candle pattern to trigger calls.
Based on daily chart, I am looking for stock to move lower since it has risen up to touch 20 SMA. You will see RSI go below 50 today or tomorrow on daily, and you can also look for signs on 30min chart.

Symmetrical TriangleThis can go either way, just follow it. 170c for breakout, 150p for breakdown, use triangle apex as SL. Will post PTs once it breaks


i think $HD is oversold. still open. people still going there.I think home depot is overdone here. home depot is still open and hopefully remains open. seeing people on twitter updating their houses


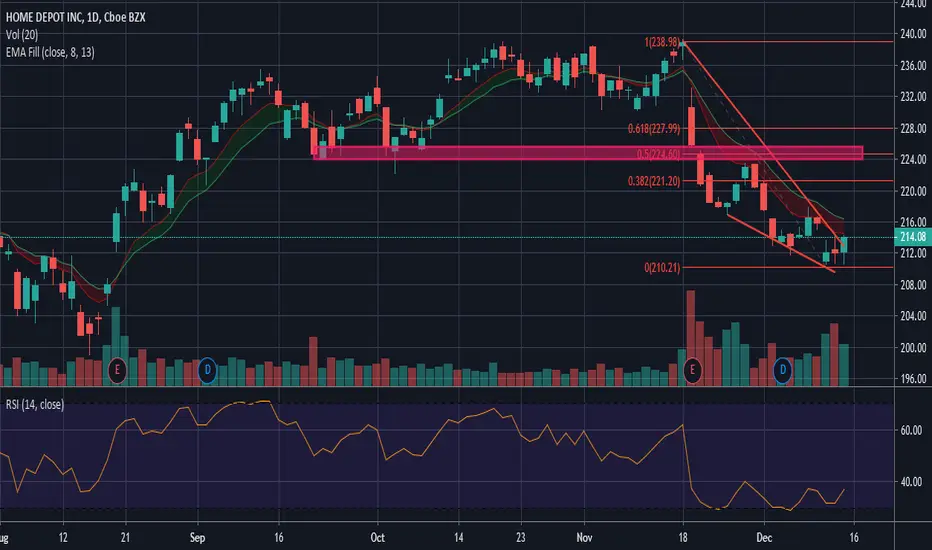
HDHD, spreads look weird on this one but im watching it below 212.5 with confirmation to 198 being 207.5


$HD reversalIf it can hold range looking for reversal after dump. Currently hanging on to 50MA and the .5 retracement - bottom of support range lines up with the 618 retracement level as well.

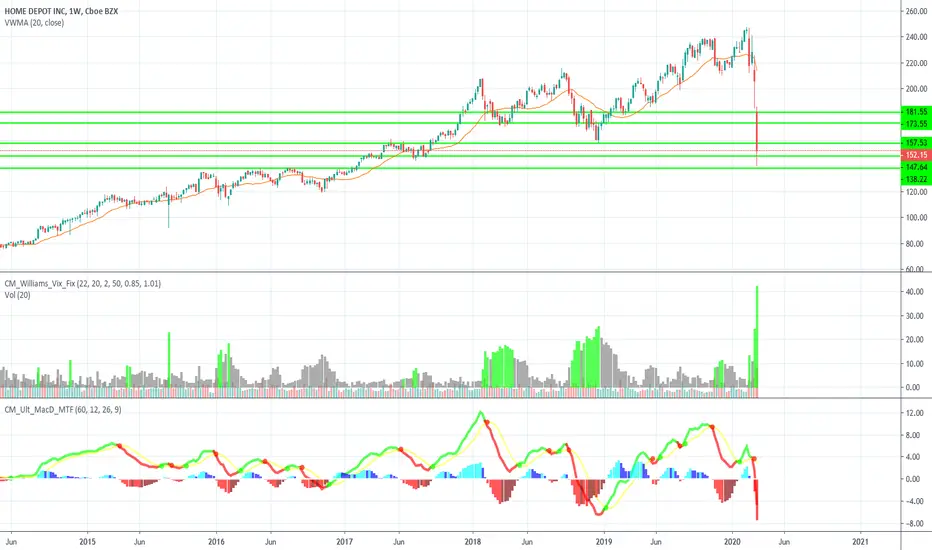
Home Depot (HD) LT Upside Targets Home depot long-term targets are the black rays. Red rays below the are old support levels that HD has either already tested or that will not be retested. There is no timing analysis here, so these are only upside targets with no regard to timing or additional downside pressure. Red lines are support lines, and the large red horizontal line at the bottom of the chart at $207 will not be broken.
NYSE:HD

Home Depot $268 target on earnings beat
Earnings per share $2.28 v consensus $2.10
Guidance for full year 2020 EPS $10.45 v consensus $10.08

HD RESISTANCE AND SUPPORT.SUPPORT AND RESISTANCE. WE DO HAVE RSI DIVERGENCE BUT THE RSI TREND NOT BROKEN YET. LOOK TO BUY IN THE RSI OVERSOLD AREA WITH DIVERGENCE OR BREAK OF RSI DOWNTREND. WE KEEP MOVING HIGHER LOOK TO SELL IN THE RESISTANCE AREAS WITH RSI SIGNAL. JUST MY GUESS.

LONG HD on touch of support at 164Levels of support/resistance typically produce a pop or bounce on the first touch.
There is an untested level of support in the valley around $164
SETUP: This is not a prediction price will get to 164. However, if it does, enter long.
I call this conditional trading.
ENTRY: $163.5
Long position
TARGET: $170 (or anything close)
This is an area below some lows that would provide resistance
STOP: $160
Below the low candle in the valley in which we took our long

HD to Test Prior All-Time HighsHD has been working on a short-term bottom since December 2019. It is now poised to test the previous all time high level again.


HD is tired at this pointShort IMO and here are few reasond: 3 times failed to break 239.50ish, RSI begin downtrend, volume decreases, China virus , Market is on the verge of cracking down, ER are soon and even if reports are good HD will go lower in order to break 239.50 on earning day. but I doubt that.

Bearish Engulfing pattern on Home DepotBearish engulfing pattern confirming a resistance level formed on HD today.


HD BounceHD on the 4-hour chart has reached its highs while being overextended beyond the bollinger band. It has also pulled away from its moving averages. This can cause a bounce off the highs which are acting as resistance trending back to the moving averages. I expect this to be a quick trade, with a 1-2 day turnaround.
