HDFC BANK 15MIN INTRDAY SETUPHDFC BANK 15MIN
Its forming a Ascending Triangle formation
and on its Demand Zone, go long on intraday level
HDB trade ideas

HDFC BANK breaking the DATE RANGEHDFC bank broke the DATE range as it followed a
1- 9 bars fall with 26 bars giving rise to the fall, finally going towards a bullish trend
2- again doing the same but it didn't break out with the 18 bars bullish or bearish hence its an indecision to buy or sell


Hdfc Bank trading setupHDFC Bank
1570-75 Resistance area
This area is multiple time tasted and today the stock is closed 13 points lower from it's high.
Breaking above 1575 will take it up to 1600.

Swing Trade PlanPlease find the SETUP on the chart............................................................................................................

HDFC BankHDFCBank making reverse Head and Shoulder Pattern , so we can clearly find in chart , in next coming days we can see some correction in HDFCbank , to make proper pattern and Ideal Target 1650-1675 1700

HDFCBANKGood breakout in hdfcbank & then retest & again moving up.
Could be bought with stop of 1535 & target of 1604

HDFCBANK SEllHDFCBANK SEll for day trading if stock break the Support then we will short the stock....


Swing Trade on #HDFCBANKPlease note the time graph is on Weekly.
Best Possible Entry - 1395-1400
SL - 1340
Target - 1600-1640
Please hit the like button if you like the idea.
Share you thoughts via the comments if you have any also if any stocks to be looked at.
If you liked the current idea and previous ideas please follow to keep the postings updated.

HDFCBANK ANALYSIS0.382 Fib-Level broken with good volumes and then a good consolidation near 0.5 level in Hourly Time Frame
Make or Break Zone: 1477-1485
Upside Target: 1500


HDFC BANKit can be a good opportunity to buy at this level
there is low risk and high reward
high probablity setup

HDFC Bank Long setupHDFC Bank Long setup : Good risk reward setup. Based on price action, a good support at top and bottom. Very small SL

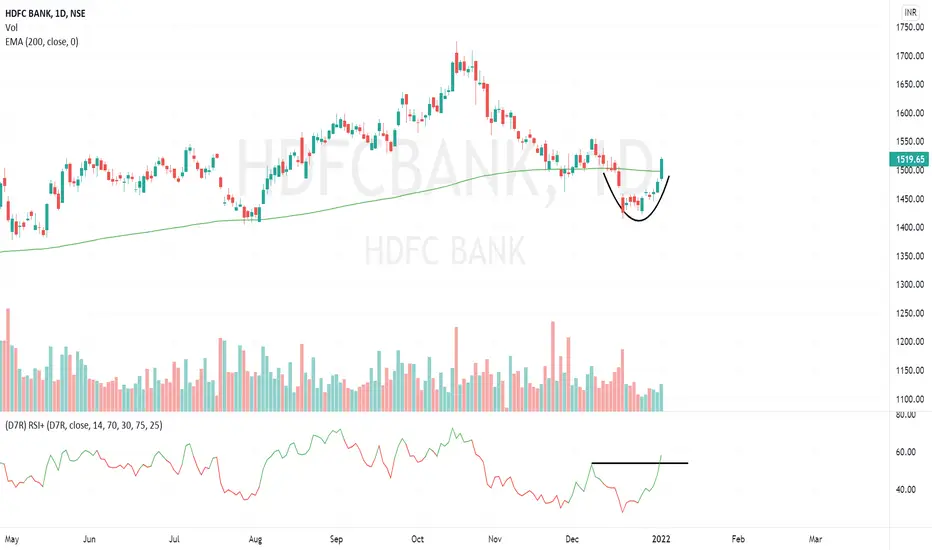
HDFC BANKAfter making a high near 1725 on 18 Oct 21 HDFC Bank Started Moving downwards.
It followed Downward Channel from 18 Oct 21 till 1st Dec 21.
It took support at the same trendline on 20 Dec 21 which was acting as Resistance earlier.
HDFC Bank is moving in consolidation zone since 20 Dec 21.
Red Line marked is the new resistance Line & Orange Line Marked is new Support line.
Now its trading below 200 EMA on Daily Chart which shows weakness.
volume reducing continuously.
Its within Decision Area to Make or Break.
It is Expected to blast upside or Downside near 28 Dec 21.
Before 18 Oct 21 it took support on 50 EMA on hourly chart.
After 18 Oct 21 50 EMA line acted as Resistance on hourly chart.
Till the time HDFC Bank crosses 200 EMA on Daily Chart and take support avoid Long Positions (200 EMA @ 1500).
And if it trade below 1400, More fall is Expected.
Resistance Levels are 1456 - 1519 - 1564.
Support Levels are 1415 - 1381 - 1371.
Risky Traders can Buy at 1415 with Target of 1498 and StopLoss @ 1398.
Safe Traders to Make Long Posn above 1500 once tested this level as support atleast once.
This is for Educational and paper trading purpose only. Must consult your financial advisor before investing or taking any position in the market. please correlate by yourself also on charts.

Rising Wedge in HDFC BANKIt is forming a rising wedge on the 30m chart frame and could break down with a strong impulse.
Entry == 1440
S.L === 1460
TARGET == 1370

BuY HDFC Bank Ltdange as per all technical indicators in daily chart, buy abv 1530 for 1650 tgt in 2 week

HDFC Bank ShortHDFC Bank may fall up to 1394.50 levels, as it show a breakout downwards from the range is was going in.


Attempting to break the RANGEWith price trading new lower level of range around 1500 with strength in complete control of sellers (from analyzer) and trend maintaining in bearish territory, odds favor breakdown.
SL will taken when POS (Trendline) is breached on closing basis on 1 timeframe lower i.e. 15min.

Hdfc bank investment mid termHdfc bank is near all time support . Start investing in hdfcbank at current rate 1475 and keep on adding in lower level of comes. Target 2000+ in two yrs or may be less
