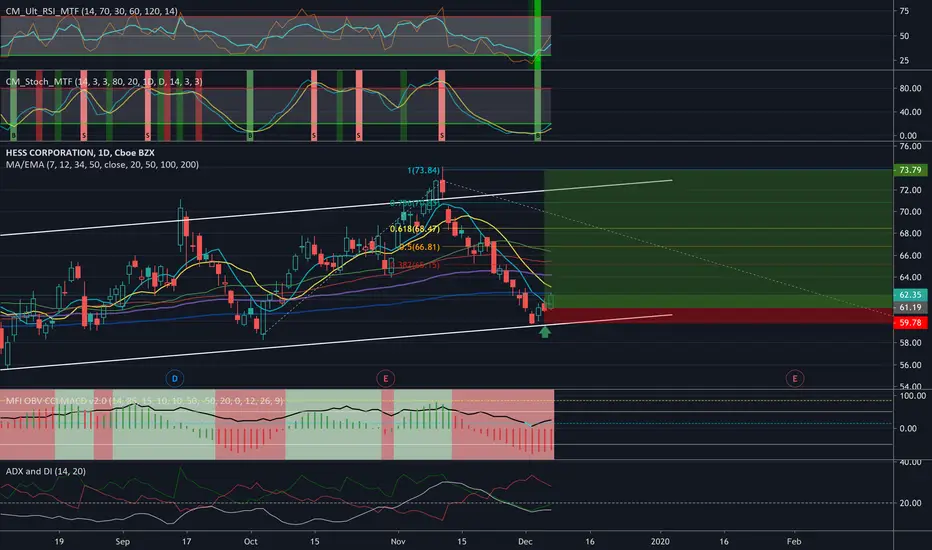
HESS SHORT potential on trendline breakdownAs HES breaks its minor upward trendline , a short position is entered with a tight stop.
As this trade progresses, longs would will be forced to exit, creating a potential for a steep move down, at least to the trend start around $43
Factors leading to the decision:
Price was rejected trying to make a new high in November, creating a new major downtrend
Medium-term upward trendline broken, so now we look for downward continuation
Very heavy volume on the bar that broke the downtrend
The bad news is there's no recent retracement to tuck a stop above... so the stop on this trade is a big wider than I like, and it will be inside the trend around $62.50
As always, use a tight-stop and if it rips down, let it run and trail stops behind.
HES trade ideas

Hess Corp on breakout watch Average Recommendation: OVERWEIGHT Average Target Price: 73.26
Hess Corp is an exploration and production company, which engages in exploration, development, production, transportation, purchase & sale of crude oil, natural gas liquids and natural gas with production operations. It operates through the following segments: Exploration and Production and Midstream. The Exploration and Production segment explores for, develops, produces, purchases and sells crude oil, natural gas liquids and natural gas. The Midstream segment provides fee-based services including crude oil and natural gas gathering, processing of natural gas and the fractionation of natural gas liquids, transportation of crude oil by rail car, terminaling and loading crude oil and natural gas liquids, and the storage and terminaling of propane, primarily in the Bakken shale play of North Dakota. The company was founded by Leon Hess in 1920 and is headquartered in New York, NY.


HES analysts HES nearing a few minor support levels. Sorry for not posting a while back, I fully admit I have no excuses for being lazy. Sometimes I like buying after a two day breakdown because the first red candle was from uncertain people selling and the second day is from investors selling which makes me like buying second day breakdowns near support to sell a pullback Incase it’s a real breakout. I never do this with strong triangle formations or any other type of valid breakout indicators because it might pull back after the second day or the pullback will be super small. I could be totally wrong so don’t take my word for it if you don’t like it also I could be totally wrong but that’s just how I’ve noticed things.
-me


HESS Corp needs to break above $65It may have had a decent performance in 2019, but market uncertainties have held back any rally, we consider $65 to be a level for considering a long.
AVERAGE ANALYSTS PRICE TARGET $71
AVERAGE ANALYSTS RECOMMENDATION OVERWEIGHT
P/E RATIO
SHORT INTEREST 4.5%
COMPANY PROFILE
Hess Corp is an exploration and production company, which engages in exploration, development, production, transportation, purchase & sale of crude oil, natural gas liquids and natural gas with production operations. It operates through the following segments: Exploration and Production and Midstream. The Exploration and Production segment explores for, develops, produces, purchases and sells crude oil, natural gas liquids and natural gas. The Midstream segment provides fee-based services including crude oil and natural gas gathering, processing of natural gas and the fractionation of natural gas liquids, transportation of crude oil by rail car, terminaling and loading crude oil and natural gas liquids, and the storage and terminaling of propane, primarily in the Bakken shale play of North Dakota. The company was founded by Leon Hess in 1920 and is headquartered in New York, NY.


HES Corp at key levelHess Corporation is currently at a key level. Breaking this level could trigger more than 20% down. My PV is about $67 but as you can see was already there, so I would wait for some opportunity around $42.
Wish you the Best!
Learn how to beat the market as Professional Trader with an ex-insider!
Have a Nice Trading Week!
Cream Live Trading, Best Regards!

HES offers tight stoploss short It's daring to short oil/engergy stocks lately, but here it comes an opportunity with low stoploss - HES.
Reason r=for short (05/21):
- Divergences RSI, MACD
- Double top inside resistance region
- End of 138.2% abc-like structure
SL placed right above the highlighted region. TP can be safely set at POC of 56.

HES Detected possible stock repurchase!!!HES: hess corp
2018-03-08 07:33:16
Detected possible stock repurchase


HES support bounce 10/10/2008 weekly low (not close) was 45.68. If oil can hold here at pre-opec cut prices, HES should bounce depending were weekly candle close. Blue TL is monthly Feb '16 high and Sep '16 low (highest volume months since '16 lows). Light red daily TL snapped to 6/30/'16 high & 11/30/'16 low

$HES perfect Inverse H&S- Right shoulder formed at 46.37
- Left shoulder April 20th 46.39
- bounced off lower kelt strong sign
Playing $49C .14 entry
On potential gap play tomorrow with oil to push or strict technical play here
-TheTradingNinja


$HES at critical long term support $HES at critical long term support. Do or die long term. This is weekly chart. Volatility is cheap for the options to take a long term cheap "bait". Also has a seasonal pattern for Feb of 80% with an average move of 5%+
