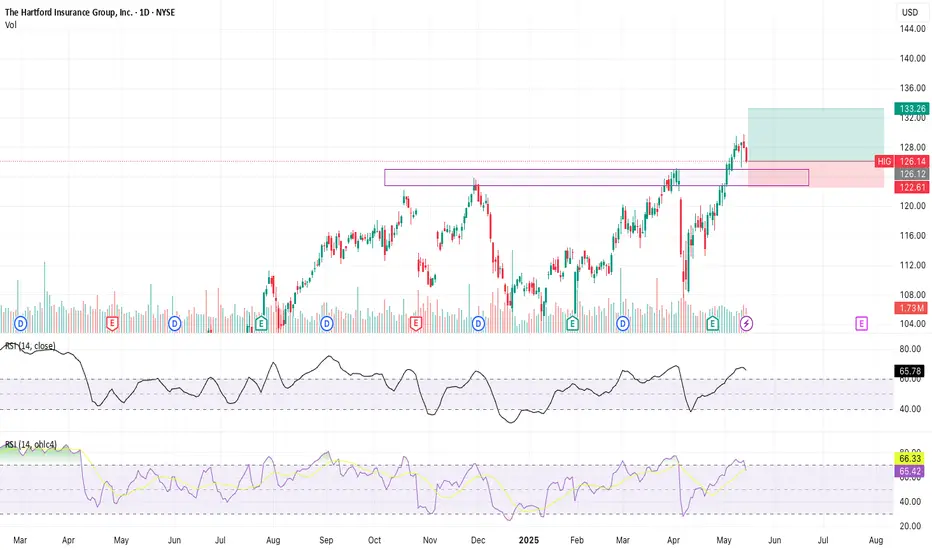
HIG LongFinancials look good
technical indicators show long signals
positional trade based on chart pattern
Next report date
—
Report period
—
EPS estimate
—
Revenue estimate
—
10.19 USD
3.11 B USD
26.54 B USD
283.02 M
About The Hartford Insurance Group, Inc.
Sector
Industry
CEO
Christopher J. Swift
Website
Headquarters
Hartford
Founded
1810
FIGI
BBG000G0Z878
The Hartford Insurance Group, Inc. is an insurance and financial services company. It operates through the following segments: Commercial Lines, Personal Lines, Property & Casualty Other Operations, Group Benefits, Hartford Funds, and Corporate. The Commercial Lines segment provides workers' compensation, property, automobile, liability and umbrella coverage under several different products. The Personal Lines segment offers standard automobile, homeowners, and personal umbrella coverage to individuals. The Property & Casualty Other Operations segment includes certain property and casualty operations, managed by the company, that have discontinued writing new business and substantially all of the company's asbestos and environmental exposures. The Group Benefits segment provides group life, accident, and disability coverage, as well as group retiree health and voluntary benefits. The Hartford Funds segment offers investment products for retail and retirement accounts and provides investment management and administrative services. The Corporate segment includes corporate category discontinued operations, reserves for run-off structured settlement, and terminal funding agreement liabilities, restructuring costs, and capital raising activities. The company was founded by Terry Nathaniel on May 10, 1810, and is headquartered in Hartford, CT.
Related stocks
HIG - Circles Predicting MovementExpect similar movement as to that within the oval shape in green through the fib circle. The Fib Circle touches the lowest point on the chart which is the 08' crash in white circle
Drew the circles using the strongest trend lines on the chart that also align with significant events, that being the

The Hartford. Head & Shoulders Strategy Takeaways the GlenThe Hartford Financial Services Group, Inc., usually known as The Hartford, is a United States-based investment and insurance company. The Hartford is a Fortune 500 company headquartered in its namesake city of Hartford, Connecticut.
It was ranked 160th in Fortune 500 in the year of 2020. The compa

HARTFORD Stock Chart Fibonacci Analysis 101423 Trading Idea
1) Find a FIBO slingshot
2) Check FIBO 61.80% level
3) Entry Point > 70/61.80%
Chart time frame : B
A) 15 min(1W-3M)
B) 1 hr(3M-6M)
C) 4 hr(6M-1year)
D) 1 day(1-3years)
Stock progress : A
A) Keep rising over 61.80% resistance
B) 61.80% resistance
C) Hit the bottom
D) Hit the top

$HIG with a bullish outlook following its earnings #StocksThe PEAD projected a bullish outlook for $HIG after a Negative over reaction following its earnings release placing the stock in drift C with an expected accuracy of 71.43%.

$HIG with a Bullish outlook following its earnings #Stocks The PEAD projected a Bullish outlook for $HIG after a Negative over reaction following its earnings release placing the stock in drift C with an expected accuracy of 60%.

HIG - Right ShoulderInverted head and shoulders pattern on this 9H timeframe This is all within a larger uptrend, the right shoulder could also be considered a test of the bottom of the larger up channel

$HIG with a Neutral outlook following its earnings #Stocks The PEAD projected a Neutral outlook for $HIG after a Negative Under reaction following its earnings release placing the stock in drift D with an expected accuracy of 80%.

Long term hold for HIGHIG gearing up to new highs.
Potentially a good long term hold. Financial services do well in periods of high interest rates. Insurance companies invest premiums into fixed income securities to drive income, which is very important for their profitability. Expect the improvement in the interest rat

HIG Hartford Bearish divergence Weekly and DailyWeekly:
After an upwick tail, we now have a bearish divergence on MACD lines, MACD-Histogram as wel as EFI. There is even a ATR channel divergence. Stochastic RSI coming from an oversold condition and now bearish, moving in the reference area.
Daily;
A list of bearish divergences, supporting the

See all ideas
Summarizing what the indicators are suggesting.
Neutral
SellBuy
Strong sellStrong buy
Strong sellSellNeutralBuyStrong buy
Neutral
SellBuy
Strong sellStrong buy
Strong sellSellNeutralBuyStrong buy
Neutral
SellBuy
Strong sellStrong buy
Strong sellSellNeutralBuyStrong buy
An aggregate view of professional's ratings.
Neutral
SellBuy
Strong sellStrong buy
Strong sellSellNeutralBuyStrong buy
Neutral
SellBuy
Strong sellStrong buy
Strong sellSellNeutralBuyStrong buy
Neutral
SellBuy
Strong sellStrong buy
Strong sellSellNeutralBuyStrong buy
Displays a symbol's price movements over previous years to identify recurring trends.
HIG5260933
Hartford Insurance Group, Inc. 2.9% 15-SEP-2051Yield to maturity
6.98%
Maturity date
Sep 15, 2051
HIG4870486
Hartford Insurance Group, Inc. 3.6% 19-AUG-2049Yield to maturity
6.58%
Maturity date
Aug 19, 2049
HIG3995386
Hartford Insurance Group, Inc. 4.3% 15-APR-2043Yield to maturity
6.25%
Maturity date
Apr 15, 2043
HIG4610454
Hartford Insurance Group, Inc. 4.4% 15-MAR-2048Yield to maturity
6.08%
Maturity date
Mar 15, 2048
HIG3840391
Hartford Insurance Group, Inc. 6.625% 15-APR-2042Yield to maturity
5.90%
Maturity date
Apr 15, 2042
HIG.GP
Hartford Insurance Group, Inc. 6.1% 01-OCT-2041Yield to maturity
5.71%
Maturity date
Oct 1, 2041
HIG.TB
Hartford Insurance Group, Inc. 6.625% 30-MAR-2040Yield to maturity
5.69%
Maturity date
Mar 30, 2040
HIG.GO
Hartford Insurance Group, Inc. 5.95% 15-OCT-2036Yield to maturity
5.25%
Maturity date
Oct 15, 2036
HIG4870485
Hartford Insurance Group, Inc. 2.8% 19-AUG-2029Yield to maturity
4.58%
Maturity date
Aug 19, 2029
See all HIG bonds
Curated watchlists where HIG is featured.

Frequently Asked Questions
The current price of HIG is 123.35 USD — it has increased by 0.25% in the past 24 hours. Watch The Hartford Insurance Group, Inc. stock price performance more closely on the chart.
Depending on the exchange, the stock ticker may vary. For instance, on NYSE exchange The Hartford Insurance Group, Inc. stocks are traded under the ticker HIG.
HIG stock has risen by 0.37% compared to the previous week, the month change is a −2.24% fall, over the last year The Hartford Insurance Group, Inc. has showed a 20.47% increase.
We've gathered analysts' opinions on The Hartford Insurance Group, Inc. future price: according to them, HIG price has a max estimate of 163.00 USD and a min estimate of 120.00 USD. Watch HIG chart and read a more detailed The Hartford Insurance Group, Inc. stock forecast: see what analysts think of The Hartford Insurance Group, Inc. and suggest that you do with its stocks.
HIG stock is 1.05% volatile and has beta coefficient of 0.56. Track The Hartford Insurance Group, Inc. stock price on the chart and check out the list of the most volatile stocks — is The Hartford Insurance Group, Inc. there?
Today The Hartford Insurance Group, Inc. has the market capitalization of 35.04 B, it has decreased by −1.15% over the last week.
Yes, you can track The Hartford Insurance Group, Inc. financials in yearly and quarterly reports right on TradingView.
The Hartford Insurance Group, Inc. is going to release the next earnings report on Jul 28, 2025. Keep track of upcoming events with our Earnings Calendar.
HIG earnings for the last quarter are 2.20 USD per share, whereas the estimation was 2.15 USD resulting in a 2.45% surprise. The estimated earnings for the next quarter are 2.83 USD per share. See more details about The Hartford Insurance Group, Inc. earnings.
The Hartford Insurance Group, Inc. revenue for the last quarter amounts to 6.81 B USD, despite the estimated figure of 6.81 B USD. In the next quarter, revenue is expected to reach 7.04 B USD.
HIG net income for the last quarter is 630.00 M USD, while the quarter before that showed 853.00 M USD of net income which accounts for −26.14% change. Track more The Hartford Insurance Group, Inc. financial stats to get the full picture.
Yes, HIG dividends are paid quarterly. The last dividend per share was 0.52 USD. As of today, Dividend Yield (TTM)% is 1.65%. Tracking The Hartford Insurance Group, Inc. dividends might help you take more informed decisions.
The Hartford Insurance Group, Inc. dividend yield was 1.76% in 2024, and payout ratio reached 18.65%. The year before the numbers were 2.17% and 21.89% correspondingly. See high-dividend stocks and find more opportunities for your portfolio.
As of Jul 26, 2025, the company has 19.1 K employees. See our rating of the largest employees — is The Hartford Insurance Group, Inc. on this list?
Like other stocks, HIG shares are traded on stock exchanges, e.g. Nasdaq, Nyse, Euronext, and the easiest way to buy them is through an online stock broker. To do this, you need to open an account and follow a broker's procedures, then start trading. You can trade The Hartford Insurance Group, Inc. stock right from TradingView charts — choose your broker and connect to your account.
Investing in stocks requires a comprehensive research: you should carefully study all the available data, e.g. company's financials, related news, and its technical analysis. So The Hartford Insurance Group, Inc. technincal analysis shows the buy rating today, and its 1 week rating is buy. Since market conditions are prone to changes, it's worth looking a bit further into the future — according to the 1 month rating The Hartford Insurance Group, Inc. stock shows the buy signal. See more of The Hartford Insurance Group, Inc. technicals for a more comprehensive analysis.
If you're still not sure, try looking for inspiration in our curated watchlists.
If you're still not sure, try looking for inspiration in our curated watchlists.