$HIMS - ORBCLEAN breakout for NYSE:HIMS today.
DP_ORB Indicator marked it at candle close outside of ORB Zone, with confirmation bias from a higher high, and volume. All take profits were hit!
If you want the DP_ORB Indicator for FREE:
HIMS trade ideas

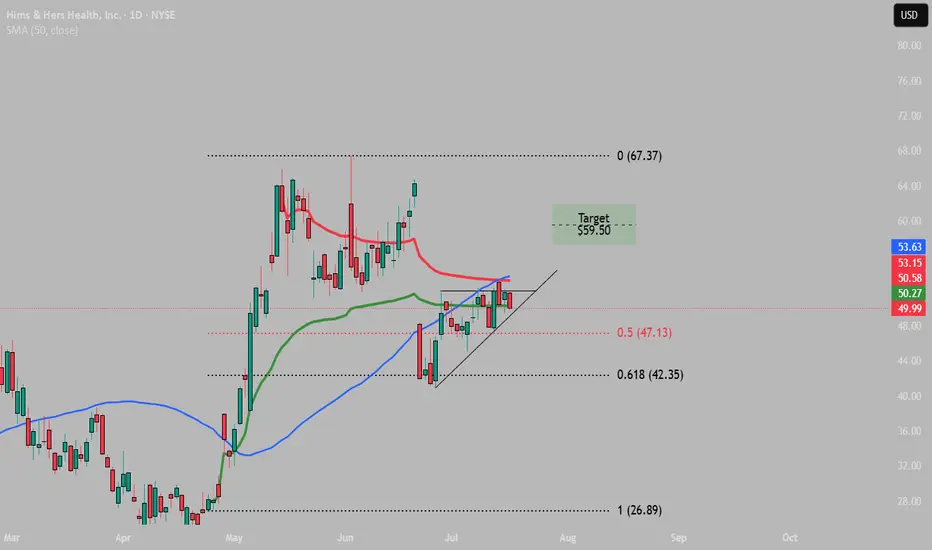
$HIMS $58 mean reversion target on horizonNYSE:HIMS daily with bullish engulfing candle. $58 pt is for gap fill.

$HIMS Squeeze Time Frame: 1D
RSI : Neutral
MACD: Bullish Cross
Fib Levels: Retraced back to 61.8%
Target:
$59.50
Pattern invalidated of drop below 61.8% ($42.35) Fib level.
My buy view for Hims & Hers stock. My buy view for Hims & Hers stock.
Overall, I believe this asset is still in a bullish direction. I remember hoping into accummulating this stock when it dropped from $64 to $41 at the open of market on 23/6/2025 which I sold off when it hit $50.
However, I still hold a strong buy bias with my entry and exit showing on my chart (analysis).
Please trade with care as I still look forward to $64 per share for this stock long-term.
Please, kindly like, share your thoughts via comment and follow me for more.

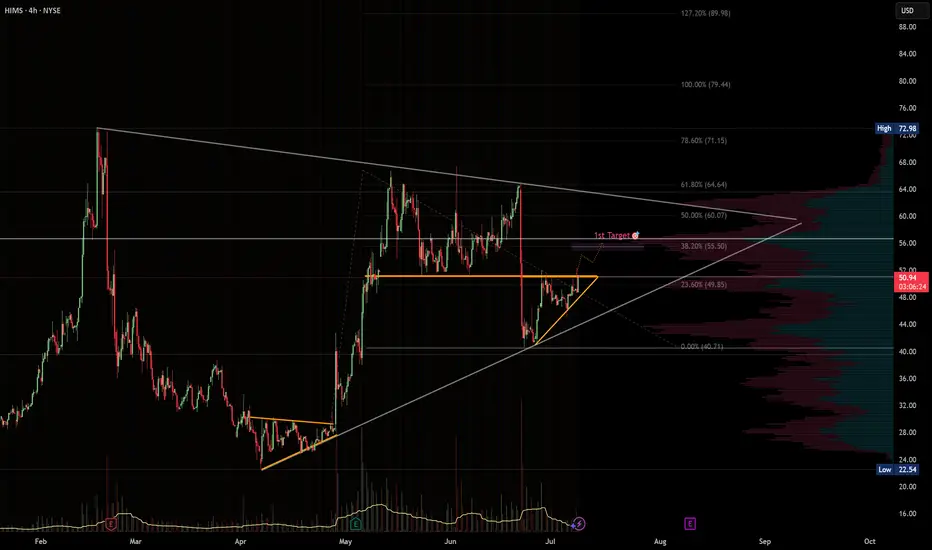
HIMS · 4H — Symmetrical Triangle Breakout Targeting $55 → $60Setup Breakdown
HIMS is forming a symmetrical triangle consolidation, with price tightening between rising support and descending resistance.
The structure follows a previous impulsive move, suggesting this is likely a bullish continuation pattern.
Volume is contracting — typical for pre-breakout setups — and price is holding above a key short-term rising trendline.
A breakout above $52–53 could initiate a fast move into the next resistance band.
---
🎯 Target Zone
🎯 Target Level Reason
Target-1 $55.50 (38.2% Fib) Volume gap fill + first resistance from prior consolidation range. A clean spot for partial profits.
Target-2 $60.00 (50% Fib) Strong historical resistance + Fibonacci confluence. Ideal level to take the rest of the position or trail a runner.
---
🛠️ Trade Plan (Example)
Component Action
Trigger Long on a confirmed breakout above $52 with volume ≥ 20-SMA
Entry Add-on Pullback retest of broken triangle resistance ($52) acting as new support
Stop-loss Close < $49.50 — invalidates the triangle
TP-1 $55.50 — take 50–70% off, move stop to breakeven
TP-2 $60.00 — exit or leave a small runner in case of further breakout
---
⚠️ Risk Notes
Earnings date approaching – trade may need to be closed or hedged before volatility spikes.
Break below $49.50 invalidates the pattern and opens risk to $46 or lower.
Watch for volume confirmation — fakeouts can occur if breakout lacks momentum.
---
✅ Checklist
Triangle structure with strong trendline support
Low-volume zone between $53–60 favors fast expansion
Targets align with Fib + volume profile
Risk clearly defined
Earnings awareness in place
> Disclaimer: This is not financial advice. Trade your own plan and manage risk appropriately.
$HIMS | Cup & Handle Setup FormingA classic cup & handle setup is building on the 4H chart.
Price just broke out of a falling channel (handle), and is now testing a key breakout zone between $48–$53. A daily close above $54–$55 with volume would confirm continuation.
I’ve mapped out three potential price targets ($73.88, $99.17, $145.34) based on the depth of the cup and Fibonacci extensions.
Watching:
RSI trending higher
Bullish trend intact via 8/21 EMA
Sub-$40 = pattern invalidation
Breakout + volume = go time. Watching closely this week.

Him Daily chart NYSE:HIMS — daily chart shaping up nicely 👀
If it breaks above $53.39, next target could be $61.57 🚀
Clean setup with ascending support — let’s see if volume steps in!

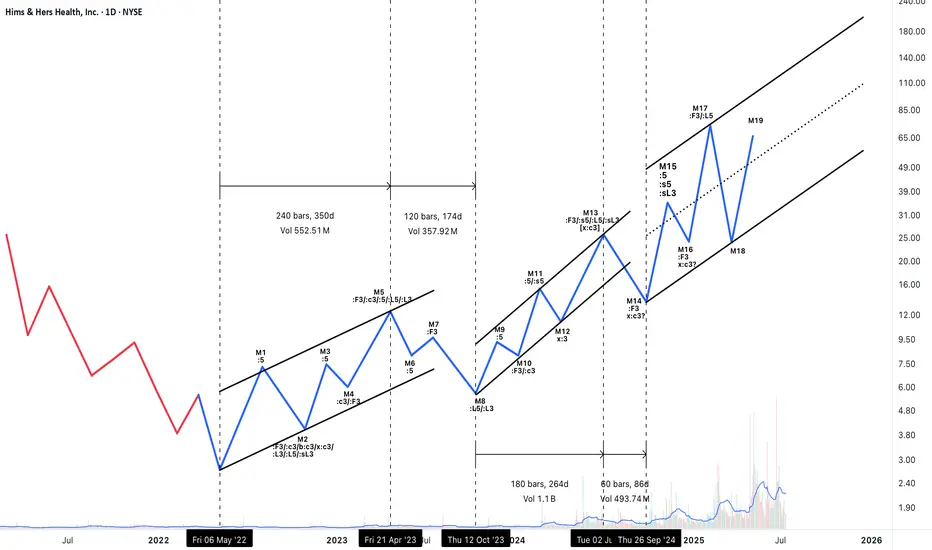
Neowave Structural Outlook – Complex Correction: W–X–Y–X–ZThis analysis interprets the ongoing structure as a Complex Correction in the form of a W–X–Y–X–Z pattern. Here's a breakdown of the logic behind the wave labeling and key observations:
Overall Structural Summary:
W wave (M1–M5): Though M1 is labeled as ":5", a closer examination of its internal structure reveals corrective characteristics. Therefore, the entire M1–M5 segment is best interpreted as a complex corrective structure, possibly a double three or flat.
X wave 1 (M6–M8): A clear Zigzag, fulfilling the requirements for a valid X. All relevant time and price criteria are met, forming a neat connector after W.
Y wave (M9–M13):
M9–M10: A Zigzag formation.
M11–M12–M13: M12 serves as an x-wave, and M13 unfolds as a simple corrective move in three waves, completing the Y wave. Though M13 is a single-leg visually, the internal structure confirms a three-part move.
The Y wave is longer in both time and complexity, appropriate for its position in the sequence.
X wave 2 (M14): Despite appearing as a short single move, it satisfies the X criteria in the context of the ongoing correction. The small size is acceptable as per rule allowances for connectors in Z formations.
Z wave (M15–ongoing):
M15–M17: Another Zigzag, forming the first leg of Z.
M18: Likely the X connector within Z.
M19: Assumed to be the beginning of the final leg of Z. The structure from here forward will determine whether Z completes as a triangle, zigzag, or another combination.
Supporting Rule Applications:
Several Neowave rules were cross-verified:
- Rule 2a and 5a were referenced to validate corrections that exceed the 61.8% retracement and duration benchmarks.
- Rule 7c and 4 supported impulse invalidations and corrections involving running structures.
Time symmetry across connectors and leg duration was considered to maintain wave consistency.
Visual Channels:
All W, Y, and Z legs are progressing within clearly defined channels.
The Z leg is currently within a steep rising channel. If Z completes as a non-triangular formation, a reversal might follow.
Conclusion & Risk Notes:
This structure, though corrective in nature, contains strong upward segments — especially within Z — making it tradable for bullish swings.
Given that Z is the final leg, caution is warranted. Once Z completes (especially if M19 develops into a three-wave structure), the larger correction may terminate, potentially leading to a larger trend reversal.
Position management (e.g., scaling out or using stop-losses) is advised as the structure evolves.
A Cheeky ScalpLet's see if the Bart pattern moves all the way down, keeping a tight stop loss below the barely holding support
HIMS - Potential Bearish ABCD & FVG Retest Setup (4H)\HIMS is currently showing signs of a potential bearish ABCD pattern forming, with the recent rejection at point A and retracement towards B, holding around the 1.617 Fibonacci extension level. A possible short-term bounce may occur toward point C (0.618 retracement), before continuing downward.
📉 Bearish Scenario:
If C confirms as a lower high, a drop toward the FVG GAP zone between $31.85 and $27.94 becomes highly probable, aligning with the 1.618–1.886 Fib extension.
The volume profile indicates a low-volume node (LVN) around the FVG, making it an attractive magnet for price.
🔍 Key Levels:
Resistance Zone (Red Box): $66–$74 (previous supply and high-volume node)
Support/FVG Target: $31.85 (1.618 ext) / $27.94 (1.886 ext)
POC above: $56.02 – potential pivot level if bulls regain control
⚠️ Watch for:
Reaction at $49.50–$50.00 resistance (0.618 retrace zone)
Volume confirmation on breakdown toward FVG zone

6/25/25 - $hims - How I'm trading this for size6/25/25 :: VROCKSTAR :: NYSE:HIMS
How I'm trading this for size
- i make a lot of moves, as you can tell. but you'll also notice i tend to find positions that i like as i validate the thesis... and go massive
- NYSE:HIMS and NASDAQ:TSLA are two names that i'm not new to, but have been wrangling for some time given valuations really haven't been "cheap" per se. there's a good reason for that.
- so $hims. i reset book last night, and now after seeing this thing to red on the day after opening to a squeeze nearly >5%... i'm back to wranging.
i. want. to. own. this.
it's scarce paper. a scarce CEO. scarce growth. and it's hitting right at the heart of the war on pharma, in it's own "novel" way that just makes me excited to root for the success.
- valuation is not honestly, expensive
- but communication and headlines will drive a lot of price action (as has been the case) now that NVO has unofficially announced that they're losing market share and, frankly, the stock is uninvestable and will ultimately underperform the winner NYSE:HIMS
- SO
- I'd like to make this a 5...10...15% size should oppty allow for it.
- but LEAPS are expensive. I also have my eye on more of a retrace toward mid 30s if we get a garden variety pullback in general risk (go read my S&P issue from last night... i still think we r trucking higher, but am prepared for this garden variety pullback as well). SHOULD THIS HAPPEN, NYSE:HIMS would be a name that probably eats more beta dirt than others given the recent action (i'm thinking from a big money institutional ownership perspective).
- therefore, i'm playing bi weekly ITM calls for size but in a paradoxical way, hoping i lose money on these... so i can grow the duration of my exposure and at a lower strike.
- for now i like the bi weekly $40s ... i'd like to extend this to monthlies should we go lower at a lower strike... and if we do see mid 30s (and i'll be writing about this name if that happens!) i'd attempt to LEAP it out for some big size.
keep me posted if u see anything worth flagging on the name
V

HIMS off to the races to fill the gapNYSE:HIMS is off to the races to fill the upside gap. The NOVO deal that fell thru is an entry opportunity for a strong performer.

Safe Entry Zone HIMS Part-2After the 150%+ profit reached. in part-0
Stock reached blue zone which was part-1 analysis target.
Now Target Reached.
Despite the termination of Novo drugs with HIMs which will hurt HIMS on long run for sure unless they figure out something.
I strongly believe despite negativity and all bad news price subjected to 55%+ run to Red Zone.
STOP LOSS is below Blue Zone. MUST BE.
Price is Volatile at current price level due to Buyers and Sellers Fighting. which is fine.
Note: 1- Potentional of Strong Buying Zone:
We have two scenarios must happen at The Mentioned Zone:
Scenarios One: strong buying volume with reversal Candle.
Scenarios Two: Fake Break-Out of The Buying Zone.
Both indicate buyers stepping in strongly. NEVER Join in unless one showed up.
2- How to Buy Stock:
On 15M TF when Marubozu Candle show up which indicate strong buyers stepping-in.
Buy on 0.5 Fibo Level of the Marubozu Candle, because price will always and always re-test the imbalance.

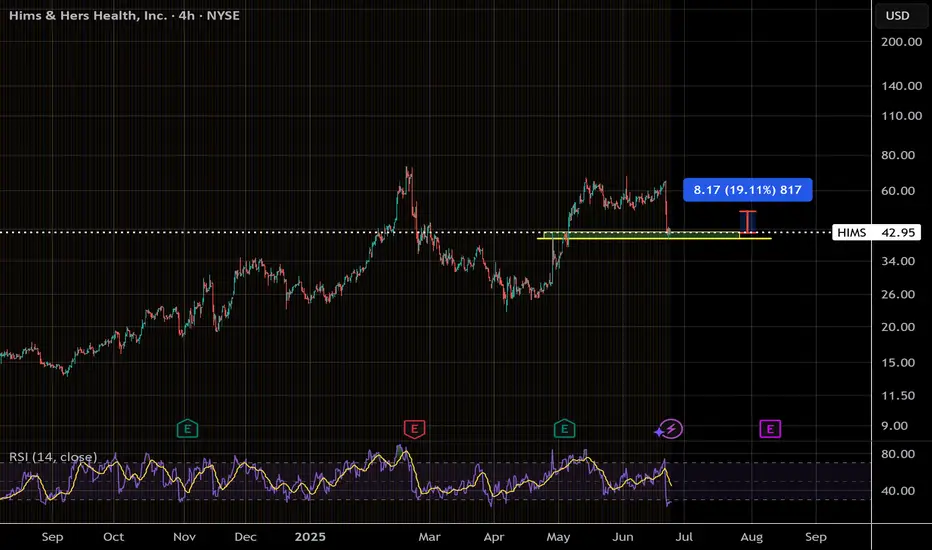
$HIMSNYSE:HIMS is hovering around $45, but demand is drying up.
Buyers seem hesitant at these levels after the hype from the Novo Nordisk breakdown faded.
Without new momentum or a catalyst, we might see a correction or sideways action until confidence returns.

HIMS – Long Setup | Potential 60% MoveHims & Hers (HIMS) just gave us a textbook Ichimoku breakout and is holding strong above the cloud after a healthy pullback.
Technical Breakdown:
Price above Kumo Cloud: Bullish structure intact.
Support held at $54.62 – key base above cloud and Tenkan-sen.
MACD is curling back after a corrective wave, showing early signs of momentum returning.
Risk/Reward: 8.59 – Extremely favorable.
Target: $93.58 (60.22% upside)
Stop: $51.78 (7.01% downside)
Rationale:
HIMS continues to ride bullish sentiment in the healthcare and telemedicine sectors. This chart has a clean continuation setup with institutional buy zones likely around $54-$55. Risk is tightly controlled, and upside potential is significant.

HIMS 1D — This pattern didn’t cook for nothingOn the daily chart of Hims & Hers Health, we’re looking at a textbook cup with handle formation — not just a pattern, but a structure backed by time, volume, and classic price behavior. The base of the cup formed steadily from February to May 2025, and as soon as the curve was complete, price transitioned into a tight consolidation — the "handle" that often masks real accumulation.
Right now, price is testing the resistance area. And it’s not just floating up there — it’s coming in hot: price has already broken through EMA 20/50/100/200 and SMA 50/200. That’s a full stack flip. This isn’t sideways noise — it’s a structural shift in control.
Volume is starting to build as price rises, confirming that demand is real and institutional positioning likely active. We’re watching a breakout zone above the handle — and when that breaks, the structure unlocks with a clear target: $107.25, roughly a 2x move from current levels.
This setup isn’t noise. It’s a long-cooked formation that’s now about to boil over. If the handle holds and price breaks through — the rest is just follow-through.

HIMS puked up its Wegovy today!Hims & Hers Health
HIMS
shares were down more than 34.63% in Monday trading, while Novo Nordisk
NVO stock was down over 5% after Novo Nordisk said it has halted its collaboration with Hims & Hers on the sale of weight loss drugs, including Wegovy.
The two companies launched a collaboration in April to bundle Wegovy through Hims & Hers' telehealth platform.
Novo Nordisk said direct access to the drug would no longer be available through Hims & Hers Health because the company "has failed to adhere to the law which prohibits mass sales of compounded drugs under the false guise of 'personalization' and are disseminating deceptive marketing that put patient safety at risk."
This stock failed to catch a bid despite the equity markets strong.

6/23/25 - $hims - Time to re-accumulate6/23/25 :: VROCKSTAR :: NYSE:HIMS
Time to re-accumulate
- NYSE:NVO are playing dirty and this is a tell and low-key admission that NYSE:HIMS holds all the power
- distribution is key... look at NASDAQ:META , NASDAQ:AAPL , $AMZN. he who holds the customer relationship makes the rules
- there is no longer a major advantage in developing pharma, the majority of solutions can now roll off patents and/or be compounded *legally*
- so what you're seeing here is cartel-like behavior from a slow motion train wreck NYSE:NVO - which i've liked the past - but ultimately the stock will lose to names like NYSE:HIMS (and other pharma too).
- so will they get sued? who tf cares. we'll buy more
- this is a rule of 40 winner, even if law suit is large, it won't affect the story and growth.
and major kudos to Andrew (the rockstar CEO) that put out this tweet. this is a founder-leader you want to put your portfolio behind when the opportunities arise. i'll be looking for oppty in the coming days/weeks to own more of this and would consider making it a decent size LT position at the right valuation, perhaps if we get back into the mid 30s. but i'm not holding my breath. this stock is scarce paper. and you know what happens to scarce paper in a USD ponzi scheme that is unwinding day by day by day.
Andrew's post:
x.com
V

Safe Entry Zone HIMSAfter reaching the Target with 150% profit.
Now the Blue Zone IC Zone(Interesting Zone or Institutional Candles Zone) is most appealing support level where we wait for Potentional of Strong Buyers to Step In.
Note: Potentional of Strong Buying Zone:
We have two scenarios must happen at The Mentioned Zone:
Scenarios One: strong buying volume with reversal Candle.
Scenarios Two: Fake Break-Out of The Buying Zone.
Both indicate buyers stepping in strongly. NEVER Join in unless one showed up.
Take Care.

HIMS - Wait for it, don't rush itI would wait for the correction to complete around the 45 zone, then start adding when the parallel channel breaks. It has already faked out once. Do not fall for this.

HIMS – Sharp Sell-Off on Novo Nordisk Fallout. Overreaction?Today, Hims & Hers Health NYSE:HIMS plunged by –28%, breaking key support around $46.
The sell-off was triggered by news that Novo Nordisk terminated its partnership with HIMS over the promotion of compounded alternatives to Wegovy, calling it “unethical.”
🔍 Key Drivers of the Drop:
• Public fallout with Novo Nordisk
• Very high trading volume (87M+) – panic selling
• RSI and Stochastic both entered oversold zones
• Key technical support at $46 was lost
🧠 Is this already priced in?
Despite the controversy, HIMS remains a strong player in telehealth and personalized treatments.
Their model isn’t solely dependent on this partnership. Investors may be overreacting.
📌 Idea: Rebound from panic-driven drop
• Entry zone: $45–46
• Target 1: $55
• Target 2: $65 (retest previous highs)
• Stop loss: $40
💬 Watch for official statements from HIMS and updates on new partnerships.

$HIMS | Direction: Long | Key Reason: Macro | (June 19, 2025) NYSE:HIMS | Direction: Long | Key Reason: Macro & Technical | (June 19, 2025)
1️⃣ Insight Summary
We’re watching for a healthy pullback into the $31–$30.10 zone on NYSE:HIMS before entering. That drop should align with both fundamental value and technical support, setting the stage for a strong bounce.
2️⃣ Trade Parameters
Bias: Long
Entry: Around $31.00–$30.10
Stop Loss: Below $21.00, with a hard stop at $19.00 if price breaks structure
Take Profit 1: $44.00
Take Profit 2: $59.71
3️⃣ Key Notes
✅ Fundamentals are solid: Revenue ~1.48B, net income ~200M, market cap ~113B. 2024 marked the first profitable year. Debt sits @ $11M, while free cash flow is ~$1.098B—low debt relative to cash flow.
✅ Ratings & margins: ~14% free cash margin, realistic forward estimates, stable beta (~3.2) and 0.15 EPS.
✅ Risk/Reward profile: Entry gives ~10–11 points of downside vs. ~13–29 points upside to targets.
✅ Technical scenario: A pullback to $30–31 acting as support would confirm our bias—monitor price action closely in this zone.
✅ Sector tailwinds: Continued momentum in telehealth, mental health, and AI-driven medical services supports upside potential.
4️⃣ Follow‑up Note
If NYSE:HIMS drops into our entry zone and shows a solid bounce or structure retest, we’ll confirm the long setup. From there, our targets at $44 and $59.71 come into clearer focus.
Please LIKE 👍, FOLLOW ✅, SHARE 🙌 and COMMENT ✍ if you enjoy this idea! Also share your ideas and charts in the comments section below! This is best way to keep it relevant, support us, keep the content here free and allow the idea to reach as many people as possible.
Disclaimer: This is not financial advice. Always conduct your own research. This content may include enhancements made using AI.

Where is HIMS set to go next?Overview of Hims & Hers Health (NYSE: HIMS):
Pros
Expanding into weight-loss treatments
-Hims successfully entered the high-demand GLP‑1 weight-loss space by selling compounded semaglutide during shortages. With branded Wegovy now available on their platform in partnership with Novo Nordisk, they’ve broadened their offering.
Solid growth & rising profitability
-Revenue surged ~18% in 2024 to $1.78 b ttm, with annual net income of $164 m.
-Q1 2025 reported >100% YoY revenue growth ($586 m) with expected profit of 20¢/share.
Strong gross margins
-At around 80–88%, comparable to peer telehealth platforms.
Diverse healthcare offerings
-Beyond weight loss: sexual health, skincare, hair loss, mental health via DTC model. Expanded further via European acquisition of ZAVA (~1.3 m subscribers).
Undervalued relative to future earnings
-Analysts project 2030 revenues of $6.5 b—implying mid‑20s% CAGR. With projected EPS ~$1.5 b, current multiples (P/E ~40x) might look reasonable long term.
Cons
GLP‑1 strategy under pressure
-The end of compounding allowances by FDA reduced their low-cost advantage.
-Dependence on cash-pay vs. insurer coverage may limit growth if insurers cap co-pays.
High valuation with risk
-Trading at ~84x trailing EPS and ~70x forward EPS—wide margin for missteps.
-Analysts average target at $38 (≈ 33% downside), 12 rate it a 'Hold'.
Competitive & regulatory headwinds
-Market crowded with telehealth players like Ro, Noom, CVS, and insurers which may undercut cash-pay model.
-Legal scrutiny over “personalized” compounded products persists; Novo lawsuits underway.
Reputation & controversy
-CEO’s political donation stirred backlash; regulatory scrutiny around ads and compounding practices.
-Platform has faced occasional service and customer trust issues.
-Disclaimer: This analysis is for informational and educational purposes only and does not constitute financial advice, investment recommendation, or an offer to buy or sell any securities. Stock prices, valuations, and performance metrics are subject to change and may be outdated. Always conduct your own due diligence and consult with a licensed financial advisor before making investment decisions. The information presented may contain inaccuracies and should not be solely relied upon for financial decisions. I am not personally liable for your own losses, this is not financial advise.
