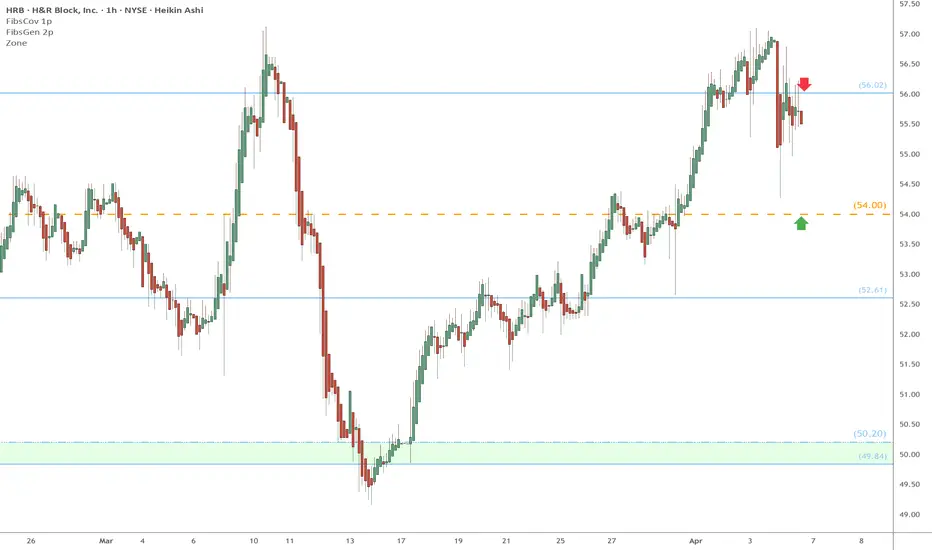
HRB watch $56 above, 54 below: buy next Dip or Break-n-Retest ?HRB should be mostly immune to Trump Tariffs (mostly).
No matter what, people will still need to file their returns.
Big changes may cause a big demand for professional help.
HRB trade ideas
H&R Block Stock Soars on Strong Earnings & $1.5 Bln Buyback PlanH&R Block (NYSE: NYSE:HRB ), the renowned tax preparation firm, has become the center of investor attention after reporting its fourth-quarter fiscal 2024 earnings, which surpassed analysts' expectations. The company's impressive performance was further bolstered by the announcement of a significant dividend increase and an ambitious share repurchase program, pushing its stock price up by 18% shortly after the market opened on Friday.
Earnings Beat Expectations
H&R Block (NYSE: NYSE:HRB ) reported revenue of $1.06 billion for the quarter ending June 30, slightly up from $1.03 billion in the same period last year. Despite a decline in net profit to $257.8 million from $302.3 million, both figures exceeded the consensus estimates compiled by Visible Alpha. For the full fiscal year 2024, H&R Block (NYSE: NYSE:HRB ) posted adjusted earnings per share (EPS) of $4.14, with total revenue reaching $3.61 billion.
The company’s fiscal 2025 outlook remains optimistic, with guidance projecting adjusted EPS between $5.15 and $5.35 and revenue in the range of $3.69 billion to $3.75 billion. This positive forecast indicates that H&R Block expects continued growth in the coming year, driven by its strategic initiatives and robust financial performance.
Dividend Increase and Share Repurchase Authorization
In addition to its strong earnings report, H&R Block (NYSE: NYSE:HRB ) announced a 17% increase in its quarterly dividend, raising it to 37.5 cents per share. This marks the seventh consecutive annual dividend increase, a testament to the company’s commitment to returning value to its shareholders.
Moreover, the Board of Directors approved a new share repurchase authorization of $1.5 billion, replacing the prior authorization. In fiscal 2024, the company repurchased and retired approximately 8 million shares, representing 5.5% of the total shares outstanding, at an aggregate price of $350 million, or $43.66 per share.
These moves highlight H&R Block’s confidence in its long-term growth prospects and its dedication to enhancing shareholder value. The combination of a dividend hike and a substantial buyback program is a clear signal that the company is well-positioned financially and is actively working to reward its investors.
CEO’s Optimism and Strategic Vision
H&R Block’s CEO, Jeff Jones, expressed his optimism about the company’s future during the earnings call. He emphasized the firm’s focus on client success and its ability to translate this success into value for shareholders. Jones highlighted the momentum the company has built, which he believes will continue into fiscal 2025 and beyond.
“We continue to make progress, gain new insight, and translate this client success into value for shareholders, and are well-positioned to build on this momentum in fiscal 2025 and beyond,” Jones stated.
Solid Financial Performance and Capital Structure
H&R Block’s financial performance in fiscal 2024 was strong across the board. The company reported a 4% increase in total revenue, primarily driven by higher net average charges and increased volumes in its Assisted category, along with greater online paid returns in the DIY segment. Despite higher labor costs and bad debt expenses, the company managed to increase its pretax income by 7.2%, reaching $762.3 million.
The company’s capital structure remains robust, with a continued focus on returning capital to shareholders. Since 2016, H&R Block (NYSE: NYSE:HRB ) has returned more than $3.9 billion to shareholders through share repurchases and dividends, reflecting its strong cash flow generation and disciplined capital management.
Positive Outlook for Fiscal 2025
Looking ahead, H&R Block (NYSE: NYSE:HRB ) expects fiscal 2025 to be another year of growth and profitability. The company’s revenue guidance of $3.69 billion to $3.75 billion, along with an EBITDA range of $975 million to $1.02 billion, underscores its confidence in maintaining its upward trajectory. The anticipated effective tax rate of approximately 13% is expected to contribute positively to the EPS, further boosting the company’s financial outlook.
Technical Outlook
At the time of this writing, H&R Block (NYSE: NYSE:HRB ) has experienced a noteworthy surge in its stock performance, with its stock price showing a remarkable increase of 11.69% during the market session on Friday. This significant upward movement is a clear indication of strong investor interest. However, it is crucial to consider that the stock currently appears to be quite overbought at this moment, which may raise some concerns for potential investors. The Relative Strength Index (RSI), currently stands at 76.81. This figure is a clear indicator that the stock may be overextended, suggesting that it could be due for a pullback or a correction in the near future.
In addition to the RSI reading, a closer examination of the daily price chart reveals a gap up pattern, which is a technical signal that often implies the stock is likely to close that gap in the near future. This pattern can indicate that while the stock has made significant gains recently, there may be a tendency for it to retrace to fill that gap. Overall, while the current performance of H&R Block (NYSE: NYSE:HRB ) stock is indeed impressive and reflects strong market sentiment, it is essential for investors to exercise due diligence and caution. Given the stock's overbought status, there is a potential risk for increased volatility or a correction, and investors should keep this in mind when making decisions regarding their investment strategies.
H&R Block’s recent earnings beat, combined with the dividend increase and share repurchase authorization, have positioned the company as a strong performer in the stock market. With its shares up nearly 40% year-to-date, H&R Block is demonstrating that it has the strategy and execution capabilities to deliver consistent value to its shareholders.

HRB - Tax Season TradeHRB is setting up for a break out of recent consolidation as we approach tax season where companies like HRB & INTU are the busiest. I suspect these companies will do well as individuals and companies are going to require help reconciling tax rule changes + trading gains from last year.
That said, the trigger to go long is a break of the Feb Value Area, $48 using the MarketWebs technical trading system

Beautiful HRB breakout just in time for tax season :) HRB consolidation breakout in an uptrend. Just in time for tax season :)

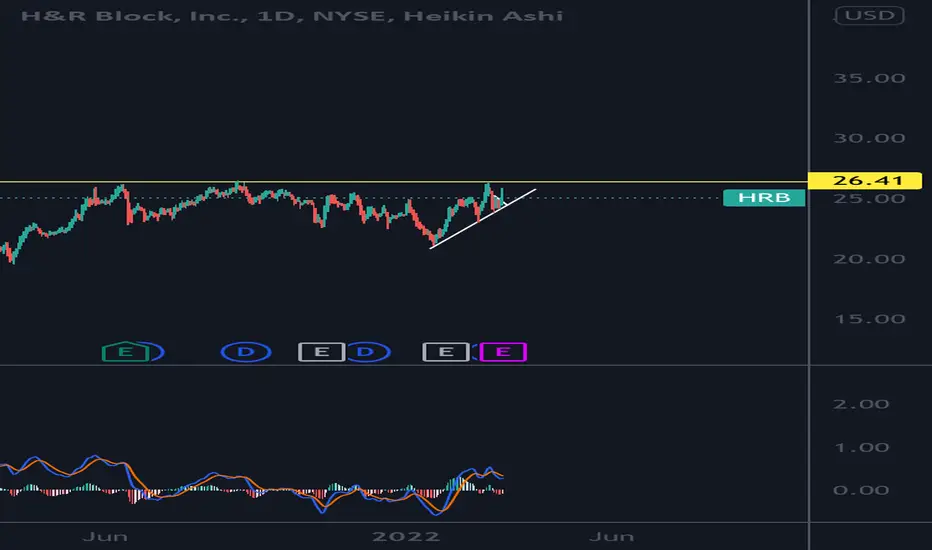
HR needs to hold c leg of the abcd pattern or 29.5should've made sense, less people filling taxes, more people on gov't assistances. unemployment, early retirement, covid, stimulus checks. this could lead into a bull flag breakout at 29.50 holding w/ support. This could lead into a 50 percent return from 25-26.50 area to $50 if you play the long game 3-5yrs. Not a bad return. Think of it as owning your own tax company for $25.00, if you're betting against it long term, you're betting against the us economy long term and the next generation if you kinda think about it. Put it on your watch for the next 3-5yrs.. along w/ tax software companies like ADP payroll thats a $214 stock currently .
side note max target 26.50 for short term

HRBJust make an entry on HRB. Based on the technical analysis, this stock is one of my stock to watch this 2023. Currently on Bullish mode on HRB.

H&R Block May Have Momentum into YearendH&R Block started rallying in May. Now, after three months of consolidation, it may be starting to move again.
The first pattern on today’s chart is the price level at $37.53. It was a previous high from November 2015 where HRB bounced in October and earlier this month. Has old resistance become new support?
Next is the falling trendline along the highs of August and September, which prices broke last week. Notice how the 50-day simple moving average (SMA) is in a similar location.
Third, the 8-day exponential moving average (EMA) recently crossed above the 21-day EMA. (This chart uses our 2 MA Ratio custom script.)
Finally, MACD has been steadily rising for the last month.
TradeStation has, for decades, advanced the trading industry, providing access to stocks, options, futures and cryptocurrencies. See our Overview for more.
Important Information
TradeStation Securities, Inc., TradeStation Crypto, Inc., and TradeStation Technologies, Inc. are each wholly owned subsidiaries of TradeStation Group, Inc., all operating, and providing products and services, under the TradeStation brand and trademark. You Can Trade, Inc. is also a wholly owned subsidiary of TradeStation Group, Inc., operating under its own brand and trademarks. TradeStation Crypto, Inc. offers to self-directed investors and traders cryptocurrency brokerage services. It is neither licensed with the SEC or the CFTC nor is it a Member of NFA. When applying for, or purchasing, accounts, subscriptions, products, and services, it is important that you know which company you will be dealing with. Please click here for further important information explaining what this means.
This content is for informational and educational purposes only. This is not a recommendation regarding any investment or investment strategy. Any opinions expressed herein are those of the author and do not represent the views or opinions of TradeStation or any of its affiliates.
Investing involves risks. Past performance, whether actual or indicated by historical tests of strategies, is no guarantee of future performance or success. There is a possibility that you may sustain a loss equal to or greater than your entire investment regardless of which asset class you trade (equities, options, futures, or digital assets); therefore, you should not invest or risk money that you cannot afford to lose. Before trading any asset class, first read the relevant risk disclosure statements on the Important Documents page, found here: www.tradestation.com .


9/18/22 HRBH&R Block, Inc. ( NYSE:HRB )
Sector: Consumer Services (Other Consumer Services)
Market Capitalization: $7.186B
Current Price: $44.93
Breakout Price: $47.10
Buy Zone (Top/Bottom Range): $44.40-$38.80
Price Target: $62.40-$64.20
Estimated Duration to Target: 152-161d
Contract of Interest: $HRB 3/17/23 45c
Trade price as of publish date: $4.65/contract


$HRB potentially coming out of a short base$HRB is sat right under a key pivot, over which it hasn't traded since 2014/15 - there are clear signs of strength and definitely worth keeping on watch

Short/Put OptionsBased on the SMA 20, 50, 200; RSI and MACD this stock is considered to be overbought and it is way above its mean in the short term. Taking a short position right now may result in decent profits or a put option of $30 strike price expiring in one month may be a good opportunity. HRB reported good earning and also have dividends leading for early investor to take their profits and a small decline in the stock price., (not an advice, it is just an observation based on the factors mentioned above, options carry more risks)

crazy rally here recently! sheesh :o HRB entering extreme resistance zone, kind of dangerous to take a long here now. congrats to people that added at the recent lows though!
above 37.52 we can see continuation to 44.2-55.17

DAILY TIMEFRAME ON $HRBHere’s the daily timeframe follow-up on H&R Block analysis.
1. The stock is still on an uptrend as price has regain the losses seen in the last week of Apr and beginning week of May due to the overall bearish market weakness.
2. Price have gone above 8/21 EMA indicating the strength of its momentum. Prices may pullback due to profit taking but given the accumulation volume on Relative Volume Pro, the pullback, if any would likely be small.
3. If the pullback goes below $29, it would suggest a larger correction otherwise, prices may see more gains.
4. If the pullback is marginal, given the price momentum and the buyers bullish sentiment, more shares could be added especially if upside recovery is fast.

H&R BLOCK GAINING MOMENTUMH&R Block seems to be gaining momentum looking at the weekly timeframe.
A daily timeframe chart follows…
1. Although price crossed the 10/30wk MA several weeks ago, it is still rising despite the difficult overall downtrend market which signifies its strength.
2. Looking at the Supertrend indicator, the regaining of the Buy-signal from the Sell-signal shows that buyers are overwhelming sellers which have resulted in a huge rise in price.
3. The white Relative Volume Pro indicator shows a high probability of stock accumulation.
4. Green bars on the Volume Weighted-Elder Impulse seems to reflect similar bullish price sentiments.
5. There could be a pullback from profit taking; stoploss at $29

HRBLook strong. Needs to pop 26.60 and confirm. Beautiful bullish push into consildation. Could be setting up while most of the market is looking weak
H&R Block - Earnings CatalystHRB set to have a bullish catalyst to continue it's upward momentum. Buy Low and Sell High on tomorrows volatility. IN MOMENTUM WE TRUST.


HRB Ascending Triangle$HRB
Ascending Triangle
Fixed Volume Profile
Long Position
Entry: 25.2
Profit Target: 27
Stop Loss: 24.5

$HRB$HRB- H&R Block at support of multi year support. If it breaks 19.22 resistance and holds, then I can see it running at least $4. Just an observation, the last two times this multi year resistance was touched, there was a nearly 1+ yr rally (see pink arrows on chart).


H&R Block, Inc (HRB) - Long: $ 18.68 then $ 19.60NYSE:HRB
💡H&R Block, Inc., or H&R Block, is an American tax preparation company operating in Canada, United States, and Australia.
📈HRB broke the downward trend-line on 25 September 2020. From the beginning of October 2020 the stock has been trading sideways on the channel between $ 17 - $ 18.50 consolidating the range.
With a golden cross taking place (50 MA over 200 MA) we are confident the stock is gaining momentum to the upside: MACD over 0 is sloping up indicating a possible reversal.
The RSI at 60 can be anyway cause of concern, however we are confident that with such a positive momentum taking place, the RSI is confirming such trend.
Fibonacci 50% level at $ 18.09, we expect the stock to gradually overcome the level and reach the 61.8% at ~ $ 19.60: at this level, we will then expect major pullbacks.
Buy price $17.50
First target $18.68 (+6.85%)
Second target $19.60 (+ 13.04%)
Stop loss $16.00 (-8.50%)
www.otbglobalinvestments.com

