HUI trade ideas

HUIThe Index for unhedged Goldminers HUI has shown some movements - up and down.
Since beginning of the year 2017 the index is catched between fibb level 23.6% and 38.2% - or shortly below.
We have had a false break out at september 08 (bull trap). And in the following weeks performing a clear shs formation.
At that time it was previsible that the index would fall - what it did.
The dynamic was so immense that it broke through the resistance and since then it has stayed below.
The positive news is, that MACD and RSI are rising and it seems they would continue a while.
But the course must cross the resistance line (23.6%) to send a positive signal.
Bollinger bands are tightening, so I think this "agony" will continue several days befor we´re about to see new dynamic.
As Gold and Silver send positive signals too I expect a rise of the HUI at the end of this period.

HUI Gold Index Breakout?The HUI has broken out of the ascending triangle and I expected it to fall further.
But it stopped and turned - perhaps the index of the goldmines will return to the triangle.
The time cycles show that around this point(+- some bars) one can expect a change in trend, as it has been in the past.
The fibb retracement is now resistance and has to be broken if HUI shall rise higher.
MACD neutral - turning to positive. MACD is above the long trend.
RSI has already turned to positive and is continuing.
If HUI can cross the resistance then it is possible that it`ll go up till 221 Points.
Past ascents lasted between 26 to 36 bars and nearly 20% gain.
This brings me to the mentioned conclusion.
I see more chances for a rise than risks for a drop.
Gold and Silver are neutral to positive. Dollar has strengthend. The fundamental facts of the explorers, royalty firms and miners are good.

HUI The Index of the unhedged miners HUI is at the moment weak.
The index is approaching the fibb retracement at 23,6% (190) . This fibb retracement isn´t a very good indicator, not so strong as others!
MACD is neutral, but the trigger line (blue) is turning down.
RSI is under 50 Points, that´s clearly negative terrain.
With a little luck, the fibb retracement at 23,6% is strong enough to halt.
So it could soon be a new buy opportunity!
Silver and Gold are also weakening and dollar is strengthening. These components have a correlation (not 1 to 1).
Whats next?
a) interest rates in US smoothly higher - no big impact (probably in 2018)
b) dollar strengthening - good for mining-stocks (but also watch the new economic power of the Yuan and Rubel)
c) Gold and Silver - prices turning, rising - good for mining-stocks


hui bottom support line reached and gold stocks are breaking outbasic trendline support and resistance

Gold Bugs Index possibly at Wave 3 up at all degrees of trend.Due to our position in the Kondratjew Cycle, I believe that the start of a multi year bull market for the gold miners is imminent.
We are close to the final leg down in the real interest rate which will bottom out at the end of our current K-Cycle which will coincide with a secular low in the Dow/Gold Ratio and a corresponding high with the gold price.

HUI Index Buy & Sell Signals on daily chartsHere a daily charts showing Buy & Sell signal based on CCI indicator (MA 200 as confirmation)


HUI Index(daily chart). At resistance.HUI Index(daily chart). At resistance.
50 , 200 sma.
Down Trend line.
Possible Elliott wave.
RSI.

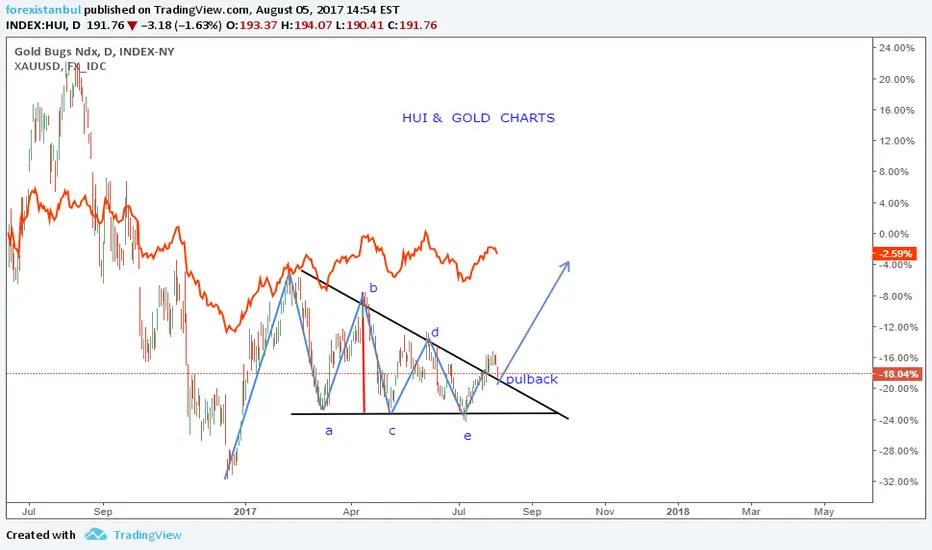
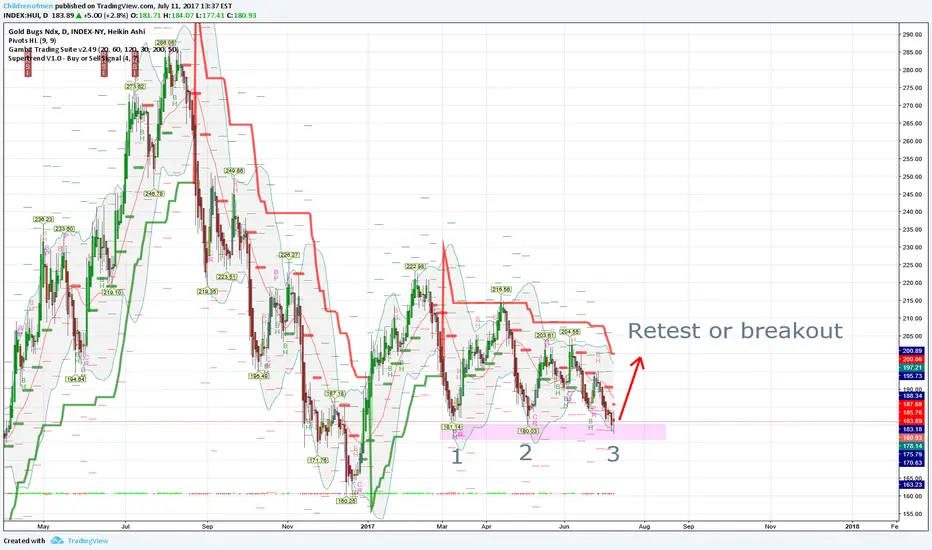
Hui index - gold Miners 3ple bottom on daily.
Expecting a retest of trendarea with a possible breakout after that (this is questionable for now) .
Buying zone here!
If you buy the index, miners or any other related gold miner index i advise close stoplosses for this trade. (keep positive r/r)
Keep an Eye on the HUI IndexThe HUI index is an excellent barometer of the rising and falling sentiment in the mining sector, that can be a key to the placing your trades at the most expeditious moments.
Following the herd cam be a killer to your portfolio when everyone is on the same side of the trade and sentiment is unanimous about direction. It might be possible to ride a trend for a short period of time and make some profits, but most people will get greedy and let it ride because they do not see the writing on the wall.
Trust me, trends always change direction. and you want to be ahead of the curve and be prepared for the change. Most of big profits happen when the trend changes and you are properly invested for the 5-7 days when the biggest swing happens, In fact, you can safely be in cash most of the time, and only invest for the few days after sentiment hits a peak or valley.
Based on my assessment of the HUI index, you can see that my two key indicators have flipped, and we appear to be at the tipping point for initiating a successful short trade in the miners right now, The Parabolic Stop and Reverse indicator (PSAR) has flipped, and the Linear Regression Curve (LRC) has peaked and has started rolling over. Additionally, the 5-10 day MA's are also confirming a trend shift.

GOLD BUGS vs SPX - WHO IS STRONGER?The mining stocks are going to be stronger than the broad markets again?


gold elections france forecastMay is a *****, sell in may on stockmarket and next leg in hui?
Or down the drain we go.

HUI Index long term secular bull marketI believe that the Goldminers (and Gold) entered a secular bull market in 2000 right after the tech bubble burst. This event marked the beginning of the ongoing Kondratieff Winter, which is a big bull market for Gold and Goldstocks.

LONG GOLD BUGS INDEX / MID TERM VIEWmonthly time frame on gold bugs index / MONTHLY bullish divergence /
FIRST TARGET 368 / 50% RETRACEMENT
SECOND TARGET 638

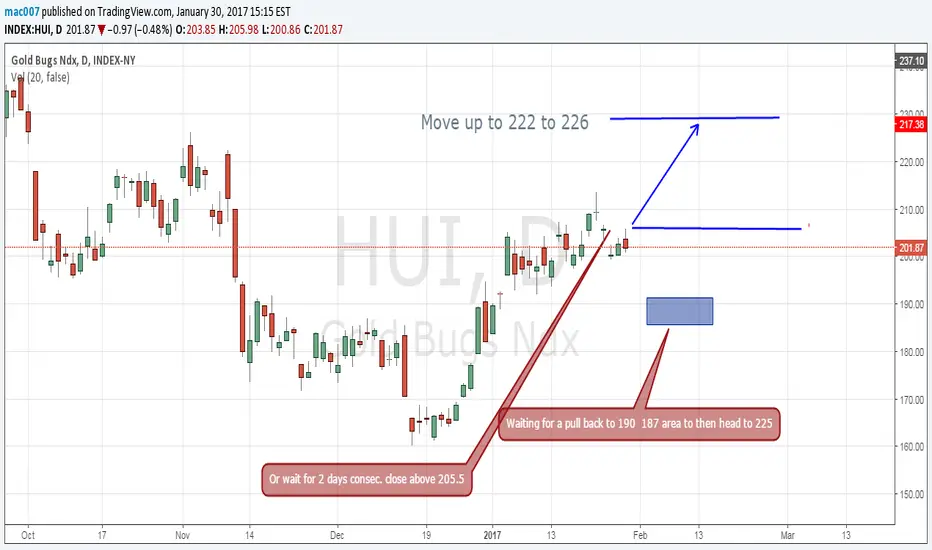
HUI on its wayWaiting for a pull back to region 188 - 190 level before heading higher.
Target 222 to 226 daily time frame. set SL to 2 x ATR
X Marks The SpotBull or Bear? Rejection earlier at long term uptrend line, but successful backtest (so far) of 3 year downtrend line. Lots of room to run if she can take out 200 or so.


HUI - DailyMore than a few miners I'm trading count similar to the Gold Bugs Index, with a complex W-X-Y move in the presumed near completion of primary wave 2.
