HUYA! Chinese Twitch, ready to take off, Long Play#HUYA Possible big reversal incoming, Multi bullish divergence printed on the daily charts. Big target for Earnings date.
Price Target short term:23.8$
Extended:28.5$
Stop loss: if bad news or china market crashes.
Video streaming platform in the biggest videogame market of the world..China. What there is to think? Only risks are represented by USA-CHINA tension and delisting threats from the American administration.
But NO RISK NO REWARD, it's what it is.
HUYA trade ideas

This chart doesn't need an explanationFlag breakout...growing volume...all point to only one direction.
$HUYA - HUYA INC // LONG$HUYA is flagging and bounced nicely around .618FIB Level. Going Forward, this should act as key support. $HUYA and $DOYU are merging; since the news they lost around 15% and 19% respectively. This merge will create a platform with +300 million users and China´s biggest video game streaming platform. $HUYA will be the ticket that remains listed.
Also, the bill forcing Chinese firms to meet US accounting standards has affecting $HUYA. IMO the bill grants enough time for any Chinese firm to comply.
Stop-loss and targets are given in the chart.

SWING TRADE - LOOK LONG XPENG - BULLISH ON GAMINGDescription
HUYA Inc., through its subsidiaries, operates game live streaming platforms in the People's Republic of China. Its platforms enable broadcasters and viewers to interact during live streaming. Its live streaming content covers a library of games, including mobile, PC, and console games; and other entertainment genres, such as talent shows, anime, outdoor activities, live chats, online theatre, and other genres. The company operates Nimo TV, a game live streaming platform primarily in Southeast Asia and Latin America. It also provides online advertising and marketing services. In addition, the company provides software development and Internet value added services. As of December 31, 2019, its live streaming content covered approximately 3,800 games. The company was founded in 2014 and is headquartered in Guangzhou, the People's Republic of China. HUYA Inc. is a subsidiary of Tencent Holdings Limited.


$HUYA Swing play
Price is supposed to break out of the descending
channel and also bouncing off the demand and S/R zone.
1st TP for the trade will be $25.10 and then further more.
The fundamentals are very solid on this.

Is Huya ready for its next upmove per Elliot Wave?May be a breakout with good volume will support this path.

Waiting for good entry point. Saw this company while doing research on another stock. The company seems to be turning things around, and it is a fast growing company in China. As for the chart i will wait for the price to go above the 50 sma line to get in. This is definitely in my watchlist.

$HUYA inside the consolidation zone working towards 28.50Massive breakout previously around in July
currently retracing back the pop since that breakout.. Should make its way to 28.50 and then ultimately to the measured move of 33.50


Let's see what happensThe chart is transforming into a bullish setup, but: the low volume and weak momentum is very concerning.
I would wait to see if we can make a higher low in the coming weeks.


Buy with strong bullish at supportWe expect Huya to resume the upside and if it fails to hold, the the 2nd lower support zone will be The Best Bet to accumulate

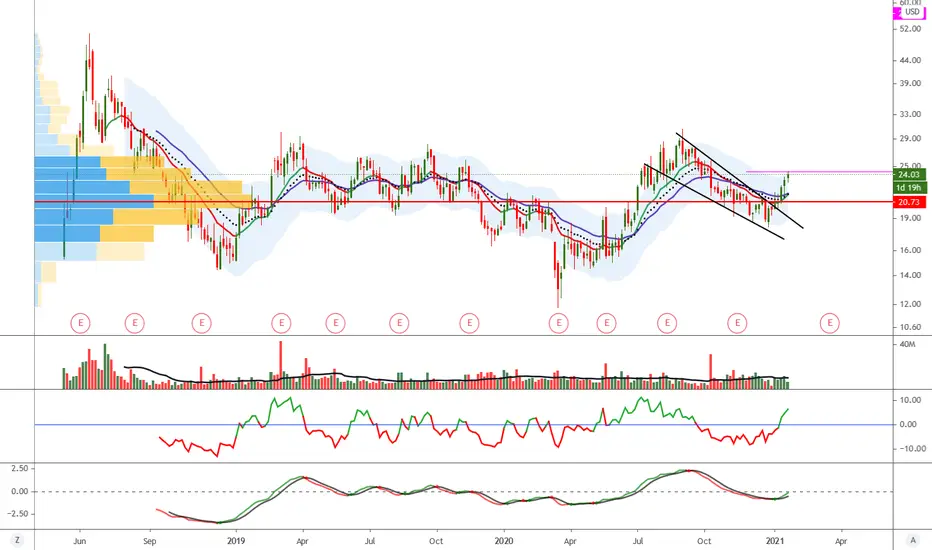
$HUYA Chart Analysis, No long Entry Yet
HUYA has been a major winner in 2020 and is now attempting to recover from the September dump.
Factors to consider -
Falling wedge formed and stock within a tight range,
Very Bullish Candle Thursday .
Indictors attempting to reverse.
12, 20, 50 ma's may act as strong resistance .
Support sits at $23.95
There is no long entry until wedge breaks, moving averages are reclaimed and we get high volume, Bulls need patience.
