IBMAs expected gapped down after trading side ways at trend line. Now supported at 116. If that is broken can see 112, 109 etc. Will likely visit 20 MA first forming lower heigh
IBM trade ideas

IBM - Bottom of Channel / $120-$122 Entry / $135 Target TOC0. IBM about to head to the top of the channel;
1. Target $135;
2. Notes to follow;
3. IBM Heading to $160;

$IBM Expectd sharp move after 4 months of consolidation $IBM was on very ugly consolidation after March low . its even did not join the party of Tech stocks and formed 4 lower highs with 3 higher lows . all scenarios are possible. it could target 144 and 106 on coming days but indicators showing negativity which suggests more down trend targeting 106 or even march lows.


IBM: Triangle PatternTriangle Pattern
TP 1 = 129.87
TP 2 = 132.11
TP 3 = 135.04
TP 4 = 138.73 (extended target)
Please don't forget to FOLLOW , LIKE and COMMENT ...
If you like my analysis:)
Thank you and Good Luck!


IBMIBM can go either way here but we should see one more bounce off of our red support line and out above the black line for an entry. If we go the other way support is at the 38.2 level with stop loss below

IBM is a buy!Hey everyone,
IBM went through it's triangle tight and now hits the Fibo time level as well as the Gann time level. Now the price should leave the triangle in trenddirection, upwards.
The moving averages are also a buy.
My Fibo price goal is around 148$.
Much fun and good luck.
Leave a follow please, my goal is 200 :)

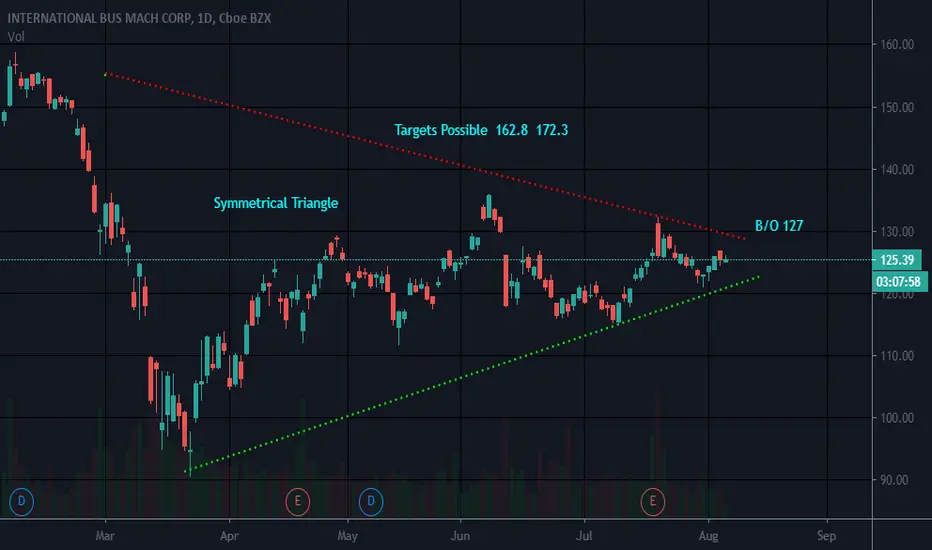
Symmetrical TriangleEarnings in October
Could break either way. Long if it breaks resistance of upper trendline
Not a recommendation


INTERNATIONAL BUSINESS MACHINES CORPORATION COM STK USD0.20 Just look , follow and enjoy
Trade and make a profit


IBM-SELL TO BULL SENTIMENT!!!!Now is time to get out of IBM. We recoment to sell at any rally!!! Targets below 120!!!

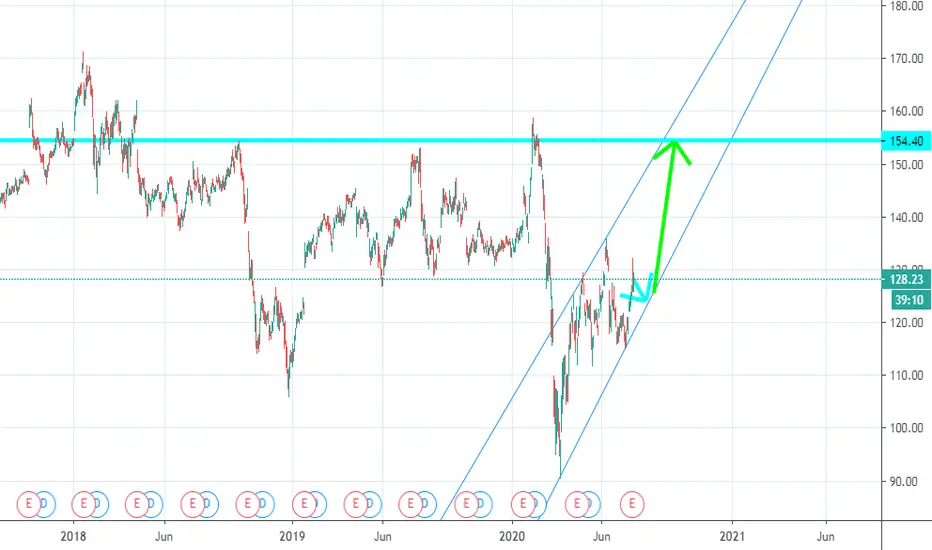
IBM where is it going? Did acquiring Red Hat had an effect in SPUnfortunately, COVID19 happened and Red Hat was purchased in July of 2019. Hence, the effect of Red Hat to IBM would not be fully realised and would be more gradual over the years. I looked at the techinical play and I found that IBM is still in the downtrend since its peak in 2013 (check weekly charts). In my humble opinion, I really think that if the pandemic did not occur then IBM would likely be trading above 160 today. If we looked at the the daily charts, I cannot help but notice that the price action is currently forming a channel that is a very similar since its last peak at $156.
My trading plan would likely be:
I'd alert at $115 and assess the situation. Then if I take a position, I would sell it at $130.


IBM Mega TriangleIBM has been making this triangle chart pattern since 1997 and will forced to a decision point one way or the other by 2026. For some investment strategies, you have to perceive time like a tree. :)
IBM's earnings and sales have been shrinking for many years-- EPS at a rate around 2.5% per year, and SPS at a rate around 0.25% per year. That makes this essentially a depreciating asset in terms of earnings and sales. The dividend over 5% offsets that somewhat, but IBM would need a growth strategy to break out to the upside. Despite technology leadership, the company has struggled to turn its technology into growth.
IBM is still worth trading within the triangle, however. It's certainly worth a buy in the event it should drop to the bottom of the triangle range. I kind of like the idea of owning a piece of IBM's AI, because I think this technology eventually will drive a turnaround story for IBM and a return to earnings and sales growth. Among other things, IBM is partnering with Verizon to use its AI in Verizon's 5g.
IBM will be a sell at triangle top until and unless the slopes of the earnings and sales trendlines begin to turn positive long-term.

$IBM - Earning Strategy - IntroductionWorking on a new Strategy to take advantage of earnings. This is how its structured to play.
Knowing your risk and keeping your expectations low gives you a sizable profit.
GET OUT OF CONVENTIONAL THINKING of Iron Condors and Iron Butterfly prior to earnings. The whole world thinks that is the edge.
Now, try to do yourself a trade on $UAA $CHTR $XOM $SHAK
