ICICI BANK HAVING SUPPORT AT 334 GAVE A NICE Q4 RESULT MAR 2020Support at 334
Buy tgt-350 and 375
Sl-330
Desclaimer :- Educational and informational purpose only trade on your own risk
IBN trade ideas

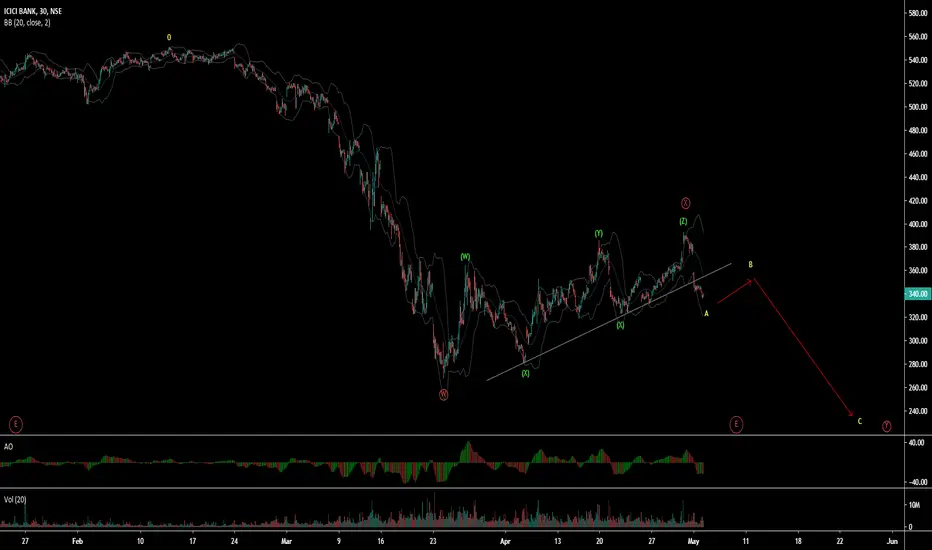
ICICI Bank Ltd (ICBK - India) - WXY wave pattern ICICI Bank Ltd (ICBK - India) is moving down in WXY corrective cycle from major top. It has completed X complex wave in flat correction. Wait for pull back of B wave to get in to the trade for C down
ICICI bank - Support at 335, 380 and 390 will be targetSupport at 335, 380 and 390 will be target in next week


ICICI Bank looking weak on chartToday all bank were weak and few of them broke important support level. If ICICI bank stays below 330 then the next level is 308 and 270. Trade only Intra day and incase you are an investor then you can accumulate for next 12 to 24 months


Is ICICI BANK a next HDFC BANK?Since i was already bearish on ICICIBANK since early FEB 2020. Now looking at market structure i see some resemblance in Eicher motors 2003-08 structure. We know what kinda price action happened post 2009 on Eicher Motors, if thats case we found our next HDFC BANK.


ICICI Bank Long Perfect Setup to go long with stop at 348 - TGT 363 , 375 ,387 - Better to play for the next 2 days.


IBN targeting 38.2% fibWe have a daily breakout. In H2/H1, we can see a retest and a bullish continuation. A target could be set at 38.2 fib of Daily chart or previous Daily S/R. I prefer the former.


ICICI BANK BREAKOUT LEVEL BULLISH VIEW TargeT 382 stoploss325In icici bank positive divergence for a TargeT 382 stoploss325
