When is a stock too high to buy? (Example: IHG)How do you know when you’ve missed the boat?
A stock has already gone up a tonne, so bascally you are too late!
Sometimes, you just have to let go, right?
Sometimes yes, but not always - let’s look at an example.
International Hotels Group (IHG)
Back in 2020, LSE:IHG IHG shares were trading down at ~2000 GBX, now they are a hairs breadth from 10,000 - that’s 5X in about 4 years. Not bad.
Can you really even think about buying shares at 10,000 that were 2,000 only 4 years ago. 🤔
We’re saying YES.. if you follow some guidelines.
Clearly this is not a value investment - this is a momentum trade.
To be buying IHG shares up here, one is basically arguing that the price at new highs indicates and buyers are in charge and the price is going to keep going up for the time being.
This helps define the trade risk very well.
If the trade is that IHG has broken out over the previous peak at ~8,800. We don’t want to be owning shares below this level - if they’re back below 8,800 the momentum has stalled and we need to be out.
To put it another way, we are not buying just under 10,000 and willing to hold the shares all the way back down to 2,000 again - no. We want to ride the momentum up - not down !
From here there’s a pretty good chance that momentum takes the price up to the 10,000 level. As a big round number, there is also a good chance that profit taking takes place here too.
That creates our buy zone between 8,800 and the current market price (9,750).
So what might a trading strategy look like to capture this situation?
The following is a way to have:
An intial risk of £1000 to test the waters
A total risk £3000 if/when the trade starts working
A 2X profit potential (with the opportunity to capture more)
Spread Betting Strategy: Target £6000+ Profit with £1000 Initial Risk
Entry Points and Stops
9000 GBX Entry:
Stop Loss: 8600 GBX.
Bet Size: £2.50 per point.
Risk: £1000.
9200 GBX Entry:
Stop Loss: 8800 GBX.
Bet Size: £2.50 per point.
Risk: £1000.
9400 GBX Entry:
Stop Loss: Trailing 400 points.
Bet Size: £2.50 per point.
Initial Risk: £1000.
Profit Targets
First Position (9000):
Gain: 1000 points.
Profit: £2500.
Second Position (9200):
Gain: 800 points.
Profit: £2000.
Third Position (9400):
Trailing Stop Profit Example:
10,400 GBX: Profit = £2500.
11,000 GBX: Profit = £4000 or more.
Summary
Total Risk: £3000.
Fixed Profit (First Two Positions): £4500.
Potential Profit (Third Position): Variable, based on trailing stop.
Reward-to-Risk Ratio: 2:1 or higher, depending on trend continuation.
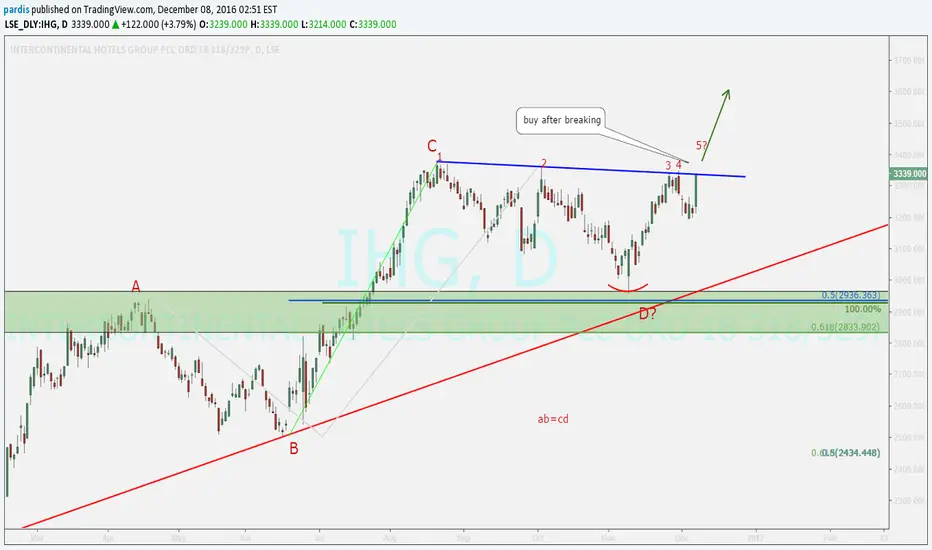
IHG trade ideas

IHG: corrective waveA typical 1, 2 and 3 wave pattern is busy unfolding.
It appears that the price action is busy with wave 4, which is a corrective wave.
The net movement of corrective waves is against the trend at one larger degree. Corrective waves typically consist of three sub-waves.
The target is set at 4650, which is just below its 200-week simple moving average.
Crossing above 4840 will negate the corrective wave.

Intercontinental Hotels Group (IHG - LSE) - WXY wave patternIntercontinental Hotels Group (IHG - LSE) is in WXY complex correction pattern from last bottom upside. Wave W is over having internal B wave as triangle, which resulted in quick reversal after it ended. X wave will made of ABC. B will end soon and starts C down for X wave.

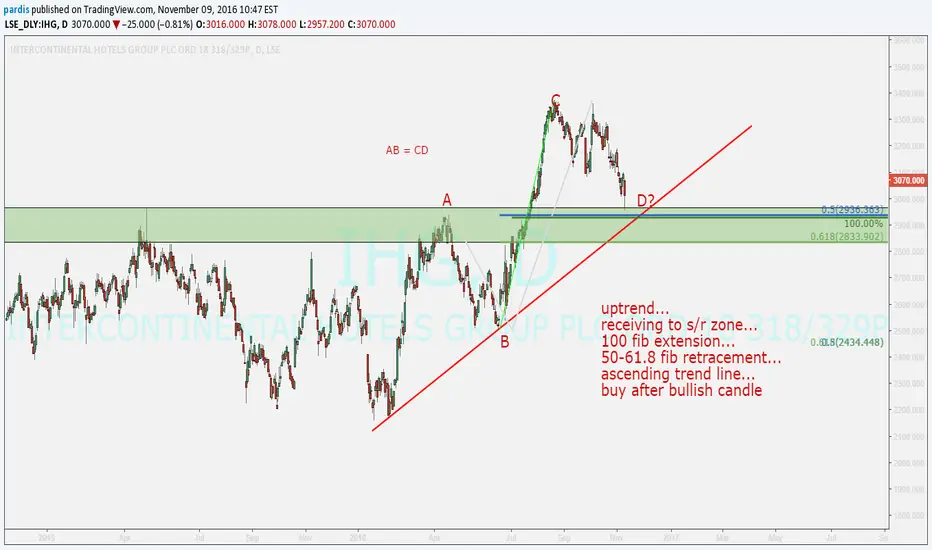
IHG - Retest of the breakout and 38.2% Fibonacci support.IHG is trading in a strong long term uptrend. The shares have corrected lower in recent weeks but buying support has been found at the previous break out level, which is now support. The correction is also inline with a 38.2% Fibonacci support level adding further weight to the bullish argument. Further upside is expected over the short to medium term.

Intercontinental Hotels Group ~ Long Swing Trade Capture bullish swing within channel. Hold until resistance level/ RSI reversal. Place stop loss at 4220. 3.5 risk/reward ratio.

Ascending Triangle Confirmed, Tough Times Ahead for IHG ?As per my previous CORRECT analysis back in April 26th (), the move upwards up to the upper trendline has been confirmed as well as the move downwards. This move downwards was quite a violent bearish move and strongly suggests that an Impulse move downwards has now started, for a long-term SHORT.
TDI confirms the strong Bearish move downwards and we should now see some consolidation, before another move downards.
If the Water EMA crosses the Blueberry EMA, it will be a good signal to SHORT this stock for a second trade. The first trade was at the top of the structure.
An elliott wave count, taken from Wave Y, would suggest the next count is an Impulse wave 1.
At this point in time, holding IHG stock would not be a good idea, as on the Daily time period the last move on the wave Y was on an Ascending Triangle, thus on the Intermediate Period, the next move is an Impulse wave 1. If this proves correct, within 2 years this stock will be worth less than $20 ~ $10, therefore Closing your position would be recommended, in my opinion.
----------------------------------------------------------------------------------------------------------------------------------------------------------
DISCLAIMER: This chart is for sharing and educational purposes only and is not intended to be a signal service or similar.
This chart analysis is only provided as my own opinion, based on my own analysis and comes with absolutely no warranty that this analysis is correct, whatsoever. Do not trade this chart if you do not have your own strategy. Trade only with your own strategy at your own risk. Plan your trade and trade your plan... and IF in doubt, stay out.
.....::::: If you like this chart, please click on the THUMBS UP ! :::::.....
----------------------------------------------------------------------------------------------------------------------------------------------------------

High Probability LONG until top trendline, before massive SHORTBased on the current Daily chart/pattern, there is a possibility to enter a LONG until the top of the channel trendline, before a substantial SHORT to the bottom of the triangle's channel trendline.
IF the bottom trendline is broken, after consolidation and crossing the Blueberry EMA, we should be able to have confirmation of a significant Impulse wave downwards for a full bearish trend, which could confirm hard times ahead for the IHG (Intercontinental Hotels Group).
TDI seems to suggest a LONG is still valid until the overbought position is reached which should then signal a great SHORT entry at least to the bottom of the channel trendline/Blueberry EMA.
Once we reach the Blueberry EMA, price action and structure should provide more information before a decision to exit the trade or continue SHORT for an Impulse.
----------------------------------------------------------------------------------------------------------------------------------------------------------
DISCLAIMER: This chart is for sharing and educational purposes only and is not intended to be a signal service or similar.
This chart analysis is only provided as my own opinion, based on my own analysis and comes with absolutely no warranty that this analysis is correct, whatsoever. Do not trade this chart if you do not have your own strategy. Trade only with your own strategy at your own risk.
Plan your trade and trade your plan... and IF in doubt, stay out.
.....::::: If you like this chart, please click on the THUMBS UP ! :::::.....
----------------------------------------------------------------------------------------------------------------------------------------------------------

New trade signaled - Buy IHG LN @ OpenIHG has outperformed the benchmark index and travel sector over the past 3 months. The shares are in a long term uptrend and have triggered a buy in our model. Buy at the open with a stop at 3186p. Target 3534p

