Swing & Positional Trading and Stock Options Setup _ High Beta✅ Final Setup for Positional and Swing Trades (High Beta Liquid Stocks for Cash and Options)
This trading guide outlines a simple and effective setup for both positional and swing trades, focused on high beta, highly liquid stocks. Follow the rules strictly for better consistency and profitability.
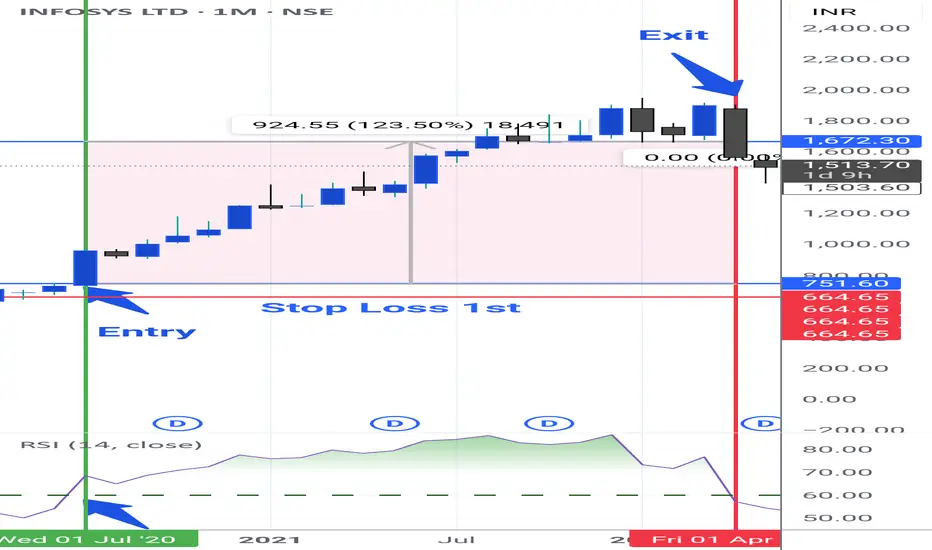
🔹 Positional Trade Setup
Chart Setup:
• Open the Monthly Chart of the stock.
• Add the RSI (Relative Strength Index) indicator.
• Uncheck all levels (30, 50, 70) and only keep one level at 60.
• Edit the level from 70 to 60 and highlight it in green.
Entry Criteria:
• Stock must cross the 60 RSI level on the monthly chart.
• Entry is only triggered if the price breaks the previous month's high.
Stop Loss:
• Place the initial stop loss below the previous month's low.
Trailing Stop Loss:
• Trail the stop loss to the current month’s low, but only after the monthly candle closes.
• Continue trailing the stop loss every month using this method until exit.
Exit Rule:
• Exit the positional trade only if the current month’s candle closes below the previous month’s low.
⚡ Note: The RSI 60+ setup is a powerful momentum strategy with high reward probability.
🔹 Swing Trade Setup
Precondition:
• Monthly RSI must cross above the 60 level.
• Switch to the Daily Chart of the stock.
• Entry Criteria:
• Identify the current swing high on the daily chart.
• Entry is triggered only when the stock breaks the swing high.
Stop Loss:
• Place the stop loss below the current swing low.
• If unsure how to mark swing low, then use a daily close below RSI 60 as your stop.
Trailing Stop Loss:
• If the trade moves in your favor, trail the stop loss to each day’s low.
Exit Rule:
• Exit the swing trade only if RSI crosses back below 60 with a daily candle close.
🔥 Stock Options Trading Strategy – Built on Core Swing/Positional Principles (75% Win Rate Setup)
I’m now sharing a Stock Options Trading Concept that follows the same core principles but is tailored specifically for liquid stock options.
For this strategy, you will strictly focus only on those High Beta Liquid Stocks provided below-
✅ Strategy Setup
🔹 Timeframe Filters:
• Monthly RSI > 60 (RSI has crossed and is holding above 60)
• Weekly RSI > 60 (same condition as above)
• Daily RSI: RSI must be crossing 60 or on the verge of crossing
Now, on the Daily Chart, mark the current swing high and swing low.
📌 Two Entry Approaches:
Approach 1: Breakout Entry
• Entry: When swing high is broken.
• Stop Loss (SL): Swing low or previous week’s low.
Approach 2: Pullback Entry
• Wait for a retracement from swing high (should not exceed 50% retracement).
• Confirmation of pullback weakness: Volume bars should be shrinking/decreasing.
• Entry: On breakout of the last candle high of the pullback.
• Stop Loss: Swing low or previous week’s low.
Once in the trade, trail your stop loss to cost after 3 consecutive bullish candles.
📤 Exit Rules
• Exit the Stock Options position only if the Daily RSI closses below 60 level.
⚠️ Important Guidelines for Stock Options
• 💡 Trade with only 1 lot. Never exceed your lot size.
• 📅 Enter after 2 days of the monthly expiry and exit before 2 days of next monthly expiry to avoid smart money manipulation.
• 🎯 Choose strike prices in multiples of 25, 50, 75, or 100 for better liquidity.
Example: If stock is at 1564, choose 1550 ITM or 1575 ATM.
• ⏱️ For quick exits, always place exit orders at round numbers like 5 or 10 levels.
• Example: If you entered at ₹70 and the option is at ₹144, place an exit at ₹140 or ₹145—not any random price.
For PE buying-
Monthly RSI < 40
Weekly RSI < 40
Daily RSi crossing 40 or below
Same process for PE with 2 approach as you like but in reverse form.
📊 75 High-Beta, Highly Liquid NSE Stocks
These stocks are liquid, fundamentally strong, and mostly traded in the F&O segment — giving you both flexibility and depth.
🚗 Auto
• Bajaj Auto
• Bosch Ltd
• Eicher Motors
• Hero Motocorp
• Maruti Suzuki
• TVS Motors
• Tata Motors
🏦 Banking & Financial Services
• Bank of Baroda
• Kotak Mahindra Bank
• Axis Bank
• ICICI Bank
• HDFC Bank
• IndusInd Bank
• Bajaj Finserv
• Bajaj Finance
• SBI
🧪 Chemicals
• Aarti Industries
• Atul Ltd
• Navin Fluorine
• UPL
• Tata Chemicals
🍫 FMCG
• Britannia Industries
• Godrej Consumer
• Tata Consumer
• DMart
• Hindustan Unilever
• Dabur
💊 Pharma & Healthcare
• Apollo Hospitals
• Alkem Labs
• Biocon
• Divis Labs
• Dr. Reddy’s
• IPCA Labs
• Laurus Labs
• Lupin
• Aurobindo Pharma
• Sun Pharma
• Cipla
💻 IT Sector
• HCL Technologies
• Infosys
• LTIMindtree
• TCS
• Tech Mahindra
• Wipro
⛓️ Steel & Metals
• APL Apollo Tubes
• JSW Steel
• Jindal Steel
• Tata Steel
• Hindalco
• L&T
🛢️ Oil & Gas
• Reliance Industries
• Gujarat Gas
• Indraprastha Gas (IGL)
• Mahanagar Gas (MGL)
• Tata Power
🏢 Realty
• DLF Ltd
• Godrej Properties
• Lodha (Macrotech Developers)
• Oberoi Realty
• Phoenix Mills
🛋️ Durables & Others
• Sona BLW (Sona Comstar)
• Amber Enterprises
• Bata India
• Crompton Greaves
• Dixon Technologies
• Titan Company
• ACC Cement
• Ambuja Cement
• Ultratech Cement
• Voltas Ltd
• Polycab India
• Mazagon Dock (Mazdock)
• Asian Paints
• Berger Paints
📝 Final Thoughts
This is not just a strategy — it’s a framework to reprogram your trading mindset. Use higher timeframes, respect structure, and focus only on high-probability setups. You’re not here for noise. You’re here for moves that matter.
If this helped you, prepare a trading journal based on this strategy. Stay focused. Be consistent. Trade less, but trade right.
Midcap and Small cap stocks are only used for Positional Trading Long Setup for longer periods ex 6 months to a year.
INFY trade ideas
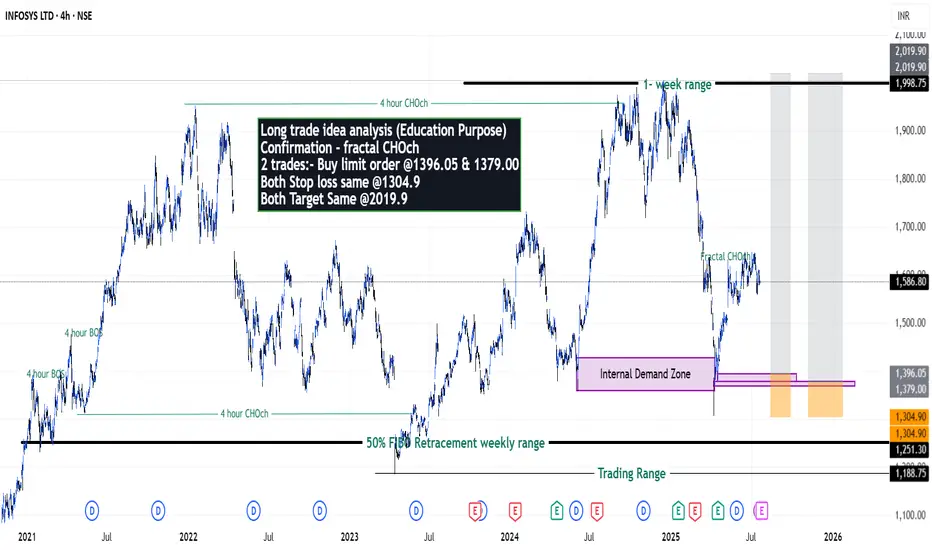
Infosys on getting ready for new high? - {20/07/2025}Educational Analysis says that Infosys (Indian Stock) may give trend Trading opportunities from this range, according to my technical analysis.
Broker - NA
So, my analysis is based on a top-down approach from weekly to trend range to internal trend range.
So my analysis comprises of two structures: 1) Break of structure on weekly range and 2) Trading Range to fill the remaining fair value gap
Let's see what this Stock brings to the table for us in the future.
DISCLAIMER:-
This is not an entry signal. THIS IS FOR EDUCATIONAL PURPOSES ONLY.
I HAVE NO CONCERNS WITH YOUR PROFITS OR LOSS on trades you take from my setup educated analysis.
My Analysis is:-
Short term trend may be go to the Internal demand zone.
Long term trend breaks the creates all time new high.
Long trade idea analysis (Education Purpose)
Confirmation - fractal CHOch
2 trades:- Buy limit order @1396.05 & 1379.00
Both Stop loss same @1304.9
Both Target Same @2019.9
Happy Trading,
Stocks & Commodities TradeAnalysis.
Gan Fan analysis of InfyGan Fan Line for infy the Gan Fan analysis for the infy has become so much important at this stage to make a long term decision watch the video till end


Looking to buy infosys when the range of 1650 gets broken...looking to buy infosys when the price of 1650 get broken decisively..
it can give good returns,final target oF 1960-1970..
it's a complete swing trade

InfyWhenever marked structure is broken on upper side infy can give good risk to reward trade. However no one knows how much further consolidation can happen.It has slowly started making positive price action above lower time frame 200 ema.
This is just for education and no buying or selling recommendations.
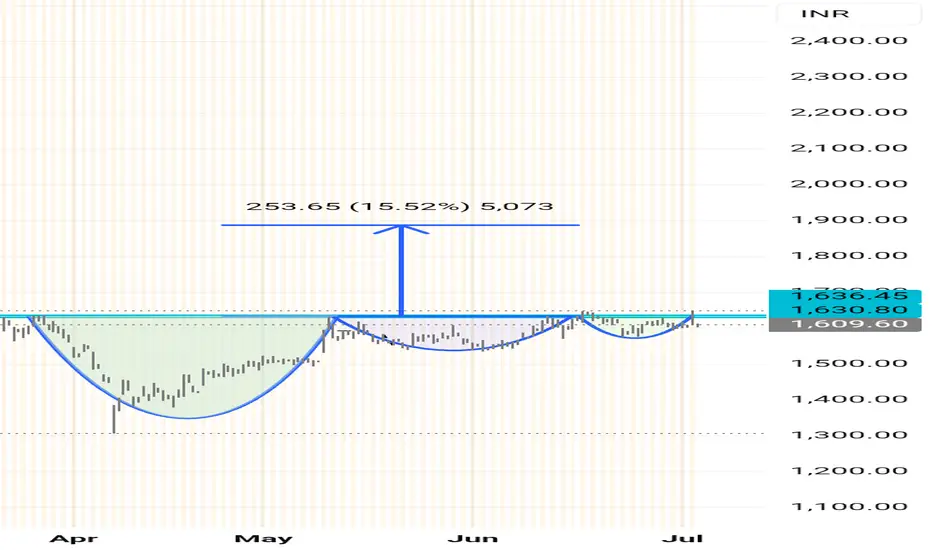
INFOSYS 📊 Chart Analysis – Infosys Ltd (INFY)
Currently, the stock is testing a key resistance zone between ₹1620–₹1630.
If the price breaks and closes above this resistance, it can signal a strong bullish breakout.
---
💼 Trade Setup (Based on Cup and Handle Pattern):
Entry (Buy): On a closing above ₹1640
Stop Loss: ₹1570
Target 1: ₹1700
Target 2: ₹1780
---
This is a classic Cup and Handle breakout setup, which often indicates the start of an upward trend.
If you find this helpful and want more FREE forecasts in TradingView, Hit the 'BOOST' button
Drop some feedback in the comments below! (e.g., What did you find most useful?
How can we improve?)
Your support is appreciated!
Now, it's your turn!
Be sure to leave a comment; let us know how you see this opportunity and forecast.
Have a successful week
DISCLAIMER: I am NOT a SEBI registered advisor or a financial adviser. All the views are for educational purpose only

INFY_Neutral to Long- Price near one of the Resistances.
- Price has not broke out; However it showed good strength with big green candle
- Wait till how the next 2 days are going to be .

INFY | Buy @LTP | SL below 1525 | Targets 1880, 2000Disclaimer:
This is not financial advice. Please do your own research or consult with a financial advisor before making any investment decisions. Investments in stocks can be risky and may result in loss of capital.

Infy Bullish Infy 1563 is showing signs of bullish for target 1620. Support 1549.
Currently Undervalued and has potential to target 1833.

INFY 1H Chart Analysis (Bullish Bat + Falling Wedge)NSE:INFY
INFY 1H Chart Analysis (Bullish Bat + Falling Wedge)
In this 1-hour chart of Infosys Ltd (NSE: INFY), a Bullish Bat Harmonic Pattern has completed at point D, suggesting a potential reversal zone. Additionally, a falling wedge formation adds to the bullish confluence.
1. Pattern Structure:
The chart displays a complete Bullish Bat Pattern (X-A-B-C-D).
Point D aligns with the PRZ (Potential Reversal Zone), with a CD leg extending \~1.618 of BC, supporting a bullish reversal.
2. Falling Wedge Pattern;
A falling wedge, generally a bullish pattern, has formed from point C to D.
A breakout above the wedge trendline may confirm a bullish move.
3. Price Action:
The price is testing the upper boundary of the wedge.
Buying interest is visible at the P,R,Z near ₹1,540–₹1,545.
Trade Plan:
Buy Entry: Above ₹1,555 (confirmation breakout above wedge)
Stop Loss: Below ₹1,538 (beneath point D and wedge support)
Target 1: ₹1,568 (previous resistance)
Target 2: ₹1,611 (mid-term resistance)
Target 3: ₹1,631 (major swing high)
A strong bullish confluence exists with the harmonic pattern and falling wedge. Wait for confirmation above ₹1,555 before entering. Maintain proper risk-reward with a stop below ₹1,538.
NSE:INFY NSE:NIFTY NSE:CNXIT

Infy India is in making of big move ... Disclaimer : This is just a chart analysis based on my understanding. Do your own research before investing.
Looking at daily chart of Infosys, first a chart pattern of M was made in the past which means stock moved up and come down. Now its trying to form a inverted head and shoulder chart pattern. Infosys stock may move up from the current levels.

Infosys Ltd view for Intraday 21st May #INFY Infosys Ltd view for Intraday 21st May #INFY
Resistance 1570 Watching above 1573 for upside momentum.
Support area 1550 Below 1550 ignoring upside momentum for intraday
Watching below 1545 for downside movement...
Above 1570 ignoring downside move for intraday
Charts for Educational purposes only.
Please follow strict stop loss and risk reward if you follow the level.
Thanks,
V Trade Point

INFOSYS📈 Final Trade Plan – INFOSYS
Component Value
Trade Direction BUY
Entry Price 1578
Stop Loss (SL) 1465
Risk ₹113
Target Price 2177
Reward ₹599
Risk-Reward Ratio 5.3 ✅
Last Swing High 2004
Last Swing Low 1405
✅ Why This Trade is Strong
Strengths:
✔️ HTF, MTF, ITF all aligned UP—multi-timeframe confirmation.
✔️ Entry is backed by ITF BUFL, giving a low-risk setup for a momentum move.
✔️ MTF demand at 1523–1465 acts as a cushion if entry sees minor pullbacks.
✔️ R:R of 5.3 is strong and meets the threshold for a positional swing trade.
⚠️ Key Considerations
🔄 Entry at 1578 is at the very top of the ITF zone, so it must be a momentum-driven breakout entry. Use volume confirmation.
💸 If price falls below 1564–1465 range, it signals weakness—avoid averaging without clear reversal confirmation.
🧱 Resistance levels to monitor: 1680 (minor), 2004 (major previous high), 2177 (target zone).
🧭 Tactical Suggestions
🟨 Partial Entry: Consider 50% entry at 1578, and the rest if it retests 1525 with support.
🟩 Full Add-on: If price breaks 1600 on strong volume, consider an add-on trade with a trail SL.
🔔 Set alerts for:
Breakout above 1600
Retest zone 1525–1480
Profit booking zone around 2000–2177
📊 INFOSYS – Multi-Timeframe Demand Zone Analysis
🔷 Higher Timeframe (HTF)
Timeframe Trend Demand Logic Type Proximal Distal Avg Zone
Yearly UP Yearly Demand Rally–Rally 1259 1231 1245
Half-Yearly UP 6M Demand Rally–Rally 1259 1231 1245
Quarterly UP Qtrly Demand BUFL 1406 1311 1359
HTF Avg 1308 1258 1283
🧠 Insight: Strong long-term trend support from historical demand zones, especially Quarterly zone (1406–1311), shows consistent upward movement.
🔷 Medium Timeframe (MTF)
Timeframe Trend Demand Logic Type Proximal Distal Avg Zone
Monthly UP Monthly Demand BUFL 1480 1400 1440
Weekly UP Weekly Demand DMIP 1523 1465 1494
Daily UP Daily Demand BUFL 1523 1465 1494
MTF Avg 1509 1443 1476
🧠 Insight: Your entry of 1578 is above the MTF zone – implying a breakout buy. The demand band between 1523–1465 provides solid buffer support.
🔷 Intraday Timeframe (ITF)
Timeframe Trend Demand Logic Type Proximal Distal Avg Zone
240M UP 240M Demand BUFL 1578 1564 1571
180M UP 180M Demand BUFL 1578 1564 1571
60M UP 60M Demand BUFL 1578 1564 1571
ITF Avg 1578 1564 1571
🧠 Insight: Entry sits precisely on ITF proximal—a high conviction buy with short-term support and momentum expected from lower timeframes.

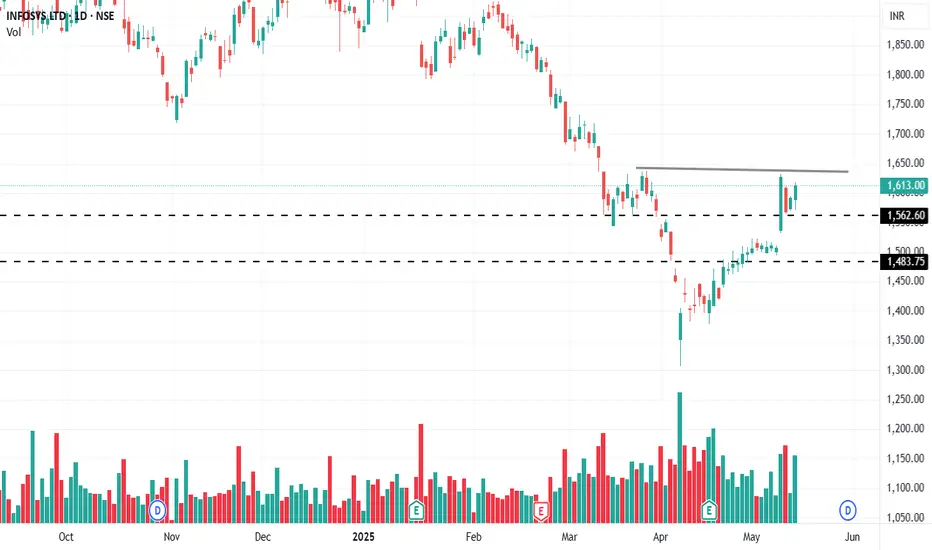
Infosys trend directionINFY 1613 is near the resistance 1643. Volume is negative. A close below 1568 would take to 1484 which would be a good entry for investment.
Infosys Long Idea on DailyInfosys has a huge volume upside breakout and looking bullish on the daily time frame
Entry Range - 1450 to 1550
Stop loss - 1350
Take Profit Range - 1900 to 2000

Infosys Ltd view for Intraday 15th May #INFY Infosys Ltd view for Intraday 15th May #INFY
Resistance 1600-1610 Watching above 1583 for upside momentum.
Support area 1550 Below 1580 ignoring upside momentum for intraday
Watching below 1545 for downside movement...
Above 1580 ignoring downside move for intraday
Charts for Educational purposes only.
Please follow strict stop loss and risk reward if you follow the level.
Thanks,
V Trade Point

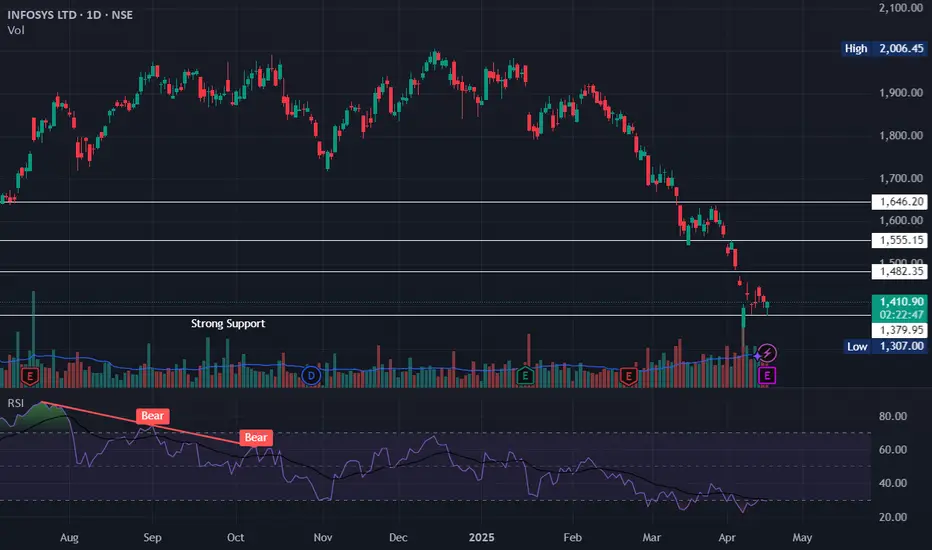
INFYThe IT sector has been under pressure for a long time and has had significant correction, but I believe that it will now undergo a positive retracement.
I saw that the INFY had a strong chance of providing a good payoff. I believe it will attempt to reach 1480, 1550, and 1650 if it crosses the 1431 level with a slight SL of 1380.
Please speak with your advisor before placing an investment; this is only for educational purposes.
Infosys Ltd view for Intraday 14th May #INFY Infosys Ltd view for Intraday 14th May #INFY
Resistance 1580 Watching above 1583 for upside movement...
Support area 1550 Below 1550 ignoring upside momentum for intraday
Watching below 1545 for downside movement...
Above 1580 ignoring downside move for intraday
Charts for Educational purposes only.
Please follow strict stop loss and risk reward if you follow the level.
Thanks,
V Trade Point

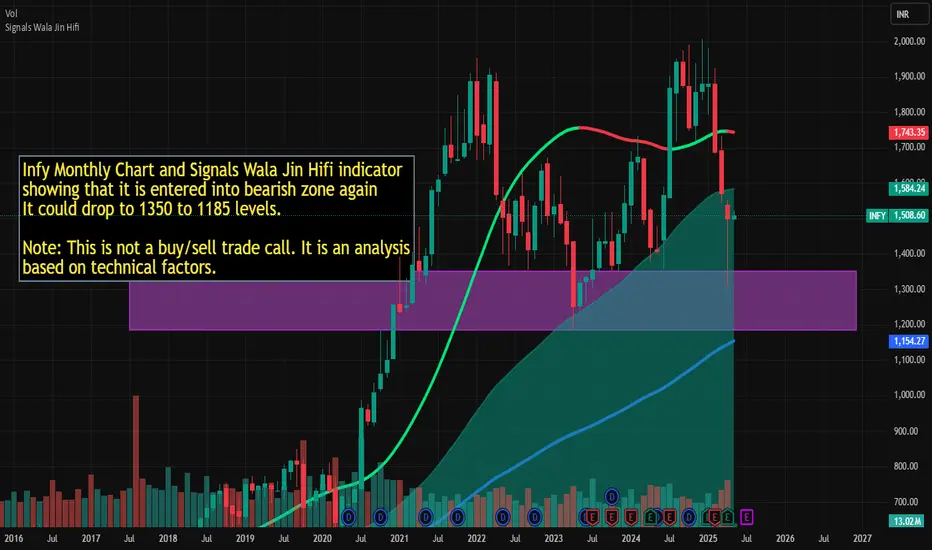
Infy could drop to 1350 to 1185 levels. Infy Monthly Chart and Signals Wala Jin Hifi indicator showing that it is entered into bearish zone again
It could drop to 1350 to 1185 levels.
Note: This is not a buy/sell trade call. It is an analysis based on technical factors.
INFY - Infosys Ltd (2 hours chart, NSE) - Long PositionINFY - Infosys Ltd (2 hours chart, NSE) - Long Position; short-term research idea.
Risk assessment: Medium {volume & support structure integrity risk}
Risk/Reward ratio ~ 2.83
Current Market Price (CMP) ~ 1480
Entry limit ~ 1455 to 1435 (Avg. - 1445) on April 28, 2025
1. Target limit ~ 1485 (+2.77%; +40 points)
2. Target limit ~ 1530 (+5.88%; +85 points)
Stop order limit ~ 1415 (-2.08%; -30 points)
Disclaimer: Investments in securities markets are subject to market risks. All information presented in this group is strictly for reference and personal study purposes only and is not a recommendation and/or a solicitation to act upon under any interpretation of the letter.
LEGEND:
{curly brackets} = observation notes
= important updates
(parentheses) = information details
~ tilde/approximation = variable value
-hyphen = fixed value

Infosys Ltd view for Intraday 24th April #INFY Infosys Ltd view for Intraday 24th April #INFY
Resistance 1480 Watching above 1483 for upside movement...
Support area 1460 Below 1460 ignoring upside momentum for intraday
Watching below 1458 for downside movement...
Above 1480 ignoring downside move for intraday
Charts for Educational purposes only.
Please follow strict stop loss and risk reward if you follow the level.
Thanks,
V Trade Point

Infosys Ltd view for Intraday 22nd April #INFY Infosys Ltd view for Intraday 22nd April #INFY
Resistance 1460-1465 Watching above 1466 for upside movement...
Support area 1445-1450 Below 1430 ignoring upside momentum for intraday
Watching below 1427 for downside movement...
Above 1445 ignoring downside move for intraday
Charts for Educational purposes only.
Please follow strict stop loss and risk reward if you follow the level.
Thanks,
V Trade Point
