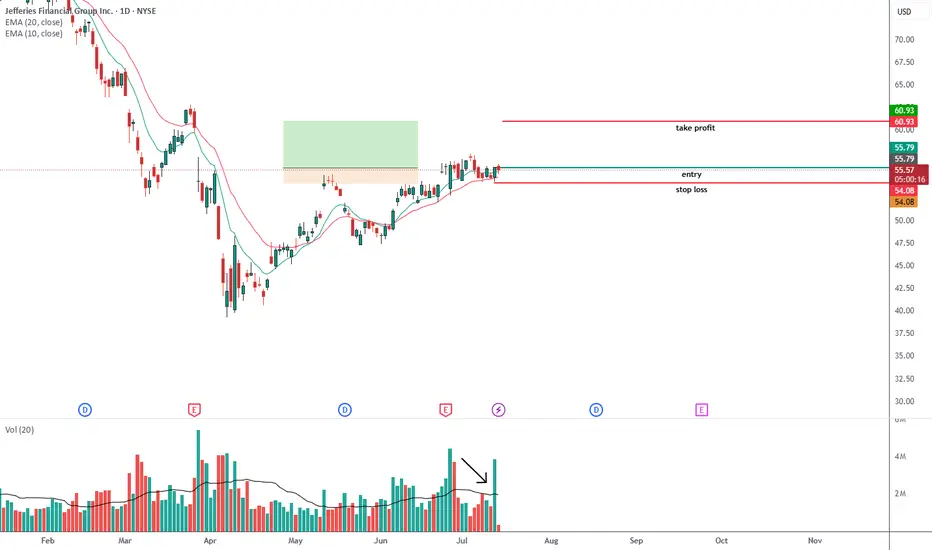
Jef -- possible swing trade opportunityJef -- possible swing trade opportunity based on price action and volume patterns
Next report date
—
Report period
—
EPS estimate
—
Revenue estimate
—
2.73 USD
665.78 M USD
10.62 B USD
164.21 M
About Jefferies Financial Group Inc.
Sector
Industry
CEO
Richard Brian Handler
Website
Headquarters
New York
Founded
1968
FIGI
BBG000BNHSP9
Jefferies Financial Group, Inc. is a holding company, which engages in the provision of financial services. It operates through Investment Banking and Capital Markets, and Asset Management. The Investment Banking and Capital Markets segment involves the provision of underwriting and financial advisory services in the Americas, Europe and the Middle East, and Asia-Pacific. The Asset Management segment includes investing seed and additional strategic capital. The company was founded in 1968 and is headquartered in New York, NY.
Related stocks
JEF Jefferies Financial Group Options Ahead of EarningsIf you haven`t bought JEF before the previous earnings:
Now analyzing the options chain and the chart patterns of JEF Jefferies Financial Group prior to the earnings report this week,
I would consider purchasing the 57.50usd strike price Calls with
an expiration date of 2025-7-18,
for a premium of

JEF: Post Earnings Drop ExpectedJEF is well above the 55 and 85 SMA on the weekly chart, so expecting earnings to bring JEF down to 64-63 after earnings on Jan 8

JEF Jefferies Financial Group Options Ahead of EarningsIf you haven`t bought JEF before the previous earnings:
Now analyzing the options chain and the chart patterns of JEF Jefferies Financial prior to the earnings report this week,
I would consider purchasing the 62.50usd strike price Calls with
an expiration date of 2024-10-18,
for a premium of appr

JEF Jefferies Financial Group Options Ahead of EarningsIf you haven`t sold JEF before the previous earnings:
Then analyzing the options chain and the chart patterns of JEF Jefferies Financial Group prior to the earnings report this week,
I would consider purchasing the 45usd strike price at the money Calls with
an expiration date of 2024-5-17,
for a p

Jefferies May Be Nearing a BreakoutJefferies Financial has been a tight range near old highs, and some traders may expect a breakout soon.
The first item on today’s chart is the ascending triangle since 2024 began. The investment bank was initially trapped under $41, but more recently has pushed above that level. Is it breaking the

Ascending Triangle Pattern in $JEFA clear ascendign triangle pattern on NYSE:JEF that shows the stock going down the following days, SMA8 crossing down the SMA20 as a signal, ideal for a Call Credit Spread

JEF Jefferies Financial Group Options Ahead of EarningsIf you haven`t sold JEF here:
Then analyzing the options chain and the chart patterns of JEF Jefferies Financial Group prior to the earnings report this week,
I would consider purchasing the 37.50usd strike price Puts with
an expiration date of 2024-1-19,
for a premium of approximately $2.12.
If t

JEF Jefferies Financial Group Options Ahead of EarningsIf you haven`t sold JEF here:
Then Analyzing the options chain of JEF Jefferies Financial Group prior to the earnings report this week,
I would consider purchasing the $32.5 strike price In the Money Puts with
an expiration date of 2023-7-21,
for a premium of approximately $1.75.
If these options

JEF Jefferies Options Ahead of EarningsLooking at the JEF Jefferies Financial Group options chain ahead of earnings , I would buy the $37.5 strike price at the money Puts with
2023-1-20 expiration date for about
$1.30 premium.
If the options turn out to be profitable Before the earnings release, i would sell at least 50%.
Looking forwar

See all ideas
Summarizing what the indicators are suggesting.
Neutral
SellBuy
Strong sellStrong buy
Strong sellSellNeutralBuyStrong buy
Neutral
SellBuy
Strong sellStrong buy
Strong sellSellNeutralBuyStrong buy
Neutral
SellBuy
Strong sellStrong buy
Strong sellSellNeutralBuyStrong buy
An aggregate view of professional's ratings.
Neutral
SellBuy
Strong sellStrong buy
Strong sellSellNeutralBuyStrong buy
Neutral
SellBuy
Strong sellStrong buy
Strong sellSellNeutralBuyStrong buy
Neutral
SellBuy
Strong sellStrong buy
Strong sellSellNeutralBuyStrong buy
Displays a symbol's price movements over previous years to identify recurring trends.
LUK4550433
Jefferies Group LLC 10.0% 31-OCT-2037Yield to maturity
15.71%
Maturity date
Oct 31, 2037
LUK4495104
Jefferies Group LLC 10.0% 31-MAY-2034Yield to maturity
15.66%
Maturity date
May 31, 2034
LUK5284767
Jefferies Group LLC 4.411605% 22-OCT-2041Yield to maturity
14.04%
Maturity date
Oct 22, 2041
LUK5210224
Jefferies Group LLC FRN 28-JUN-2041Yield to maturity
10.75%
Maturity date
Jun 28, 2041
LUK4610070
Jefferies Group LLC 7.0% 29-MAR-2038Yield to maturity
10.38%
Maturity date
Mar 29, 2038
LUK5533913
Jefferies Financial Group Inc. 7.0% 31-JAN-2043Yield to maturity
9.64%
Maturity date
Jan 31, 2043
LUK4968374
Jefferies Group LLC 8.58051% 20-MAR-2040Yield to maturity
8.90%
Maturity date
Mar 20, 2040
LUK4849569
Jefferies Group LLC 7.0% 26-JUN-2039Yield to maturity
8.70%
Maturity date
Jun 26, 2039
LUK4840045
Jefferies Group LLC 7.0943% 31-MAY-2039Yield to maturity
8.24%
Maturity date
May 31, 2039
LUK4810008
Jefferies Group LLC 5.130039% 21-MAR-2031Yield to maturity
8.14%
Maturity date
Mar 21, 2031
LUK4877355
Jefferies Group LLC 6.09027% 31-AUG-2039Yield to maturity
8.03%
Maturity date
Aug 31, 2039
See all JEF bonds
Frequently Asked Questions
The current price of JEF is 57.66 USD — it has increased by 1.02% in the past 24 hours. Watch Jefferies Financial Group Inc. stock price performance more closely on the chart.
Depending on the exchange, the stock ticker may vary. For instance, on NYSE exchange Jefferies Financial Group Inc. stocks are traded under the ticker JEF.
JEF stock has risen by 1.78% compared to the previous week, the month change is a 3.08% rise, over the last year Jefferies Financial Group Inc. has showed a 5.49% increase.
We've gathered analysts' opinions on Jefferies Financial Group Inc. future price: according to them, JEF price has a max estimate of 67.00 USD and a min estimate of 54.00 USD. Watch JEF chart and read a more detailed Jefferies Financial Group Inc. stock forecast: see what analysts think of Jefferies Financial Group Inc. and suggest that you do with its stocks.
JEF stock is 2.02% volatile and has beta coefficient of 1.65. Track Jefferies Financial Group Inc. stock price on the chart and check out the list of the most volatile stocks — is Jefferies Financial Group Inc. there?
Today Jefferies Financial Group Inc. has the market capitalization of 11.89 B, it has decreased by −1.27% over the last week.
Yes, you can track Jefferies Financial Group Inc. financials in yearly and quarterly reports right on TradingView.
Jefferies Financial Group Inc. is going to release the next earnings report on Sep 24, 2025. Keep track of upcoming events with our Earnings Calendar.
JEF earnings for the last quarter are 0.40 USD per share, whereas the estimation was 0.44 USD resulting in a −9.09% surprise. The estimated earnings for the next quarter are 0.59 USD per share. See more details about Jefferies Financial Group Inc. earnings.
Jefferies Financial Group Inc. revenue for the last quarter amounts to 1.63 B USD, despite the estimated figure of 1.56 B USD. In the next quarter, revenue is expected to reach 1.75 B USD.
JEF net income for the last quarter is 88.02 M USD, while the quarter before that showed 127.79 M USD of net income which accounts for −31.13% change. Track more Jefferies Financial Group Inc. financial stats to get the full picture.
Yes, JEF dividends are paid quarterly. The last dividend per share was 0.40 USD. As of today, Dividend Yield (TTM)% is 2.60%. Tracking Jefferies Financial Group Inc. dividends might help you take more informed decisions.
Jefferies Financial Group Inc. dividend yield was 1.64% in 2024, and payout ratio reached 43.67%. The year before the numbers were 3.39% and 108.81% correspondingly. See high-dividend stocks and find more opportunities for your portfolio.
As of Jul 26, 2025, the company has 7.82 K employees. See our rating of the largest employees — is Jefferies Financial Group Inc. on this list?
EBITDA measures a company's operating performance, its growth signifies an improvement in the efficiency of a company. Jefferies Financial Group Inc. EBITDA is 4.55 B USD, and current EBITDA margin is 43.81%. See more stats in Jefferies Financial Group Inc. financial statements.
Like other stocks, JEF shares are traded on stock exchanges, e.g. Nasdaq, Nyse, Euronext, and the easiest way to buy them is through an online stock broker. To do this, you need to open an account and follow a broker's procedures, then start trading. You can trade Jefferies Financial Group Inc. stock right from TradingView charts — choose your broker and connect to your account.
Investing in stocks requires a comprehensive research: you should carefully study all the available data, e.g. company's financials, related news, and its technical analysis. So Jefferies Financial Group Inc. technincal analysis shows the buy rating today, and its 1 week rating is buy. Since market conditions are prone to changes, it's worth looking a bit further into the future — according to the 1 month rating Jefferies Financial Group Inc. stock shows the buy signal. See more of Jefferies Financial Group Inc. technicals for a more comprehensive analysis.
If you're still not sure, try looking for inspiration in our curated watchlists.
If you're still not sure, try looking for inspiration in our curated watchlists.