Jinko Solar.....Are you ready to rumble?Hello Traders,
Jinko Solar has made a low @ USD 52.48 on June 16. After price have been pushed with a gap-up to USD 63.13 (June 21). Yesterday's trading session was an „inside-day“. Overall to speak, the gap-up creates a „Morning-star“ pattern; a bullish reversal pattern. If so, it is just a question of day's when Jinko will make new high's.
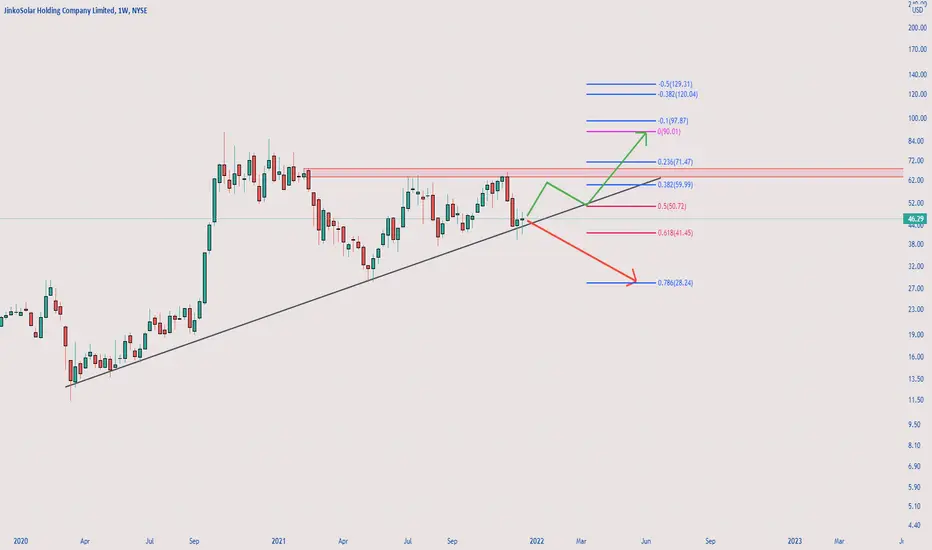
The alternate view suggests a wave „a“ to 52.48 and the advance since is all or part of wave „b“. So the next move should be to the downside, finishing a wave „c" to complete the flat structure!
A close of the open gap could be a first sign for this idea.
Update is coming within the next day's.
Have a great day.....
Ruebennase
Feel free to ask or comment!
Trading this analysis is at your own risk!
JKS trade ideas

Jinko Solar.....Tanking fuel?Hello Traders,
Jinko Solar (Ticker: JKS), a company producing Solar panels and more for the Solar industry, is moving sideways since it's high @ USD 90.20 in October 2020!
I have labeled this high as waves (A) of Intermediate degree, what stays in contrast to the labels before, which are impulsive. Please take an eye to the corrective labels since waves (A) high at the chart, `cause I am not sure to label impulsive versus corrective. I just want to show you the opportunities!
So, back to the wave (A).
If this was a fact (you always can count a wave a as a wave 1 when it moved in 5 waves), the sideways action since is just the consequence of the steep rise from 11.32 and this behavior is confirming trend.
So, overall to speak. Price have nearly met the upper trend line this week and is in a „pullback“ since. A break of this line and the level of USD 70.37 would create a new buy-trigger and open the door to 76.30-76.46 and above to the ATH @ 90.20 USD!
On the other hand!
A „failed“ break of the upper line can open the door to a correction down to the lower line @ USD 35,xx range and create a triangle, with waves (e) to follow! This week's high @ USD68.85 was a waves (d).
While Jinko Solar is a Chinese stock, the impact of a political discussion could have an enormous outcome, but with US President Biden to have spoken this week, it can give some „fuel“ to the stock price and development in the coming weeks.
So, always act with patient in this kind of stocks!
Have a great weekend.....
Ruebennase
Feel free to ask or comment!
Trading this analysis is at your own risk!
The editor is invested in this stock!

JinkoSolar May Be Attempting a BreakoutJinkoSolar has shuffled in a range for more than a year, but now the Chinese PV stock may be attempting a breakout.
Notice how JKS closed above its November high on Monday and Tuesday. The result? A new 52-week high at a time when the S&P 500 is still 14 percent below its high.
Second, the 50-day simple moving average (SMA) recently rose above the 200-day SMA. Such a “golden cross” can potentially signify the longer-term trend is turning bullish.
Third, MACD has been steadily rising for the last three weeks.
Finally, the weekly chart above shows the big surge in September 2020 after management boosted manufacturing capacity. The stock retraced almost all the move to retest and hold its pre-pandemic high. It then proceeded to make an incrementally higher low in February and has been climbing since.
Bollinger Band Width also narrowed. This is important because dramatic moves like late 2020 often need to be digested. The tighter bands may suggest this has happened. Traders waiting for the stock to move again could start to get active.
TradeStation has, for decades, advanced the trading industry, providing access to stocks, options, futures and cryptocurrencies. See our Overview for more.
Important Information
TradeStation Securities, Inc., TradeStation Crypto, Inc., and TradeStation Technologies, Inc. are each wholly owned subsidiaries of TradeStation Group, Inc., all operating, and providing products and services, under the TradeStation brand and trademark. You Can Trade, Inc. is also a wholly owned subsidiary of TradeStation Group, Inc., operating under its own brand and trademarks. TradeStation Crypto, Inc. offers to self-directed investors and traders cryptocurrency brokerage services. It is neither licensed with the SEC or the CFTC nor is it a Member of NFA. When applying for, or purchasing, accounts, subscriptions, products, and services, it is important that you know which company you will be dealing with. Please click here for further important information explaining what this means.
This content is for informational and educational purposes only. This is not a recommendation regarding any investment or investment strategy. Any opinions expressed herein are those of the author and do not represent the views or opinions of TradeStation or any of its affiliates.
Investing involves risks. Past performance, whether actual or indicated by historical tests of strategies, is no guarantee of future performance or success. There is a possibility that you may sustain a loss equal to or greater than your entire investment regardless of which asset class you trade (equities, options, futures, or digital assets); therefore, you should not invest or risk money that you cannot afford to lose. Before trading any asset class, first read the relevant risk disclosure statements on the Important Documents page, found here: www.tradestation.com .

almost time to short this one? ⚡once again we reached extreme resistance zone on JKS, will it finally break above or will history repeat itself?
watching for longs above 71.85, shorts below 62.61

$JKS Continues showing signs of strengthDespite the recent selling JKS continues to show signs of strength, and looks like it wants to breakout of this triangle pattern soon. RSI bullish confluence
Whale trade option flow and price above 30wk MA has my bias to the upside.
An idea would be to follow the whale or go long calls with another OPEX - I'm in JUN 55 calls
Watching for rejection as it isn't a breakout market right now, respect stops
Cheers

JKS - Big flag breakout
Breakout on 3D chart +++
Holding well above 50 EMA ++
Pivot trendline resistance acting as a support (for now) ++
Takeaway: Hallmarks of a leader...everything seems to looking up for this name. Sector should benefit the sympathy play due to high energy prices. Setting up for ATH.

JKS Ready to explodeBeen consolidating for quite some time, now ready to explode above the resistance trend!


Earnings watch 3/23Earnings watch 3/23
JKS
EVGO
SOL
PHUN
GIS
FSM
COOK
OLLI
TCOM
CTAS
Do your own due diligence, your risk is 100% your responsibility. This is for educational and entertainment purposes only. You win some or you learn some. Consider being charitable with some of your profit to help humankind. Good luck and happy trading friends...
*3x lucky 7s of trading*
7pt Trading compass:
Price action, entry/exit
Volume average/direction
Trend, patterns, momentum
Newsworthy current events
Revenue
Earnings
Balance sheet
7 Common mistakes:
+5% portfolio trades, capital risk management
Beware of analyst's motives
Emotions & Opinions
FOMO : bad timing, the market is ruthless, be shrewd
Lack of planning & discipline
Forgetting restraint
Obdurate repetitive errors, no adaptation
7 Important tools:
Trading View app!, Brokerage UI
Accurate indicators & settings
Wide screen monitor/s
Trading log (pencil & graph paper)
Big, organized desk
Reading books, playing chess
Sorted watch-list
Checkout my indicators:
Fibonacci VIP - volume
Fibonacci MA7 - price
pi RSI - trend momentum
TTC - trend channel
AlertiT - notification
tickerTracker - MFI Oscillator
www.tradingview.com

JKS Break of Year Long Consolidation - LongThis company showed a lot of strength this time around last year. Since then it has been consolidating in what looks like to be a giant symmetrical triangle on the Weekly.
Yesterday, it broke the triangle to the upside and fell slightly back inside. Today it broke with significant momentum and is looking to retest on the 1hr chart. Setting a close stop loss under previous higher low in case this is a fake breakout. I will also be watching the RSI on the 30Min and 1H and make sure there are no major red flags.
Yellow Lines on the right are 1st and 2nd Price targets:
T1: $96.50
T2: $125.00
Entry: $55.87
SL: $52.85
RR_1: 13
RR_2:22.5

$JKS Head & Shoulders - Downside Incoming?Looking at this Head and Shoulders pattern from mid August to present, also note the double top in last July and November. Solar sector as a whole is getting beat up everywhere at the moment, and it feels like the writing is on the wall here for $JKS
Their earnings are coming up at the start of March, so I feel there is a danger we catch a little bounce here and consolidate 'til then. However - the setup is here, and I don't want to miss it
I don't really want to see price back above $41. In fact, ideal situation tomorrow is that we get a little upwards move on the market early in the day, and I can find an good entry for a put position whilst price is above $40, with $41 as the stop. If price needs to consolidate and range a little whilst the Market digests this week's upcoming big earnings, then above $41 I don't wanna be involved in the decision making, and would rather take the trade on the breakdown rather than in anticipation if that ends up being the case.
I'm going to be going for March expiry , and I'm going to be going ITM for the main swing position. If we get clear breakdown below $39.00 with conviction then I might day trade weeklies simultaneously and just zone in on $JKS all week.
I'd like the flexibility of letting the swing position run and breathe (whilst trend remains) and trying to take scalps/day trades on weeklies. I've recently had great initial put entries on MTTR, FCEL, and back a little while longer ago on BNED - and each time I didn't show enough patience to hold my puts through long enough and I didn't capitalise nearly as much as I should have on these massive downward runs
No distinct concrete target, but I'd like at least $36.00 and even down to $32.00 I don't think is out of realm of possibility. I think anywhere below that we'll have to be on alert for a bounce around $30 region. But we'll play it as it comes. Hoping to nail this one. But willing to be wrong . Will add to this post tomorrow if I take an entry, with what I bought, when I bought, and for what price.
*this is not Financial Advice, and is merely my opinion and idea*

nice bounce off support, looking for a breakout now 💯jks bouncing right above its load zone and almost a perfect bounce off its trendline support.
look for a flag breakout for confirmation, one thats breaks i would target 50.69-55.79-64 resistance zones for an exit.
goodluck! like and follow for more 💘

$JKS - Calls > 46.75 | Puts < 43$JKS - Calls > 46.75 | Puts < 43
- Holding long term trend line
- Weekly inside bar formed
- Levels posted in the chart
Jinkosolar possible future developmentJinkosolar just does not want to forget its previous ATH: the one in 2014 and 2010 especially. Hopefully though it will soon start its third way up to reach a 100d mark.
Not a financial advice.

Solar Energy still undervaluedHello. Jinko Solar, the biggest Solar Company, is still only valued at roughly 3Billion USD.
I think Solar Energy in general is still undervalued and the Sector is just picking up and pretty bullish the coming Years as we need Green Energy desperately.
To be fair we had a pretty crazy Solar Run the last months but with a multi month/year outlook there´s still way more room to go.
I would rate this setup above average risk because of this run but expect the green 10year old S/R Zone to hold.
I think we will see another retest and this would be a good time to enter JinkoSolar and wait for new ATH´s.
This stock is Ultra volatile, dont underestimate this.
My buy Zone is 30-42 USD. (propably would suggest to ladder buy)
DYOR and please leave a like :)

JinkoSolar USA Sun Storm Investment Trading Desk & NexGen Wealth Management Service Present's: SSITD & NexGen Portfolio of the Week Series
Focus: Worldwide
By Sun Storm Investment Research & NexGen Wealth Management Service
A Profit & Solutions Strategy & Research
Trading | Investment | Stocks | ETF | Mutual Funds | Crypto | Bonds | Options | Dividend | Futures |
USA | Canada | UK | Germany | France | Italy | Rest of Europe | Mexico | India
Disclaimer: Sun Storm Investment and NexGen are not registered financial advisors, so please do your own research before trading & investing anything. This is information is for only research purposes not for actual trading & investing decision.
#debadipb #profitsolutions

resistance is breaking! time to fly? 💸JKS is finally breaking its top trendline resistance after being stuck in consolidation for a while, once the blue zone look for a rally to new all time highs.
over 64-68 resistance my price targets are 76.68-97.2-117.72
like and follow for more 💘


JKS breaks out of wedgeJinko Solar has been in a wedge, and broke out after retesting the trend line. Target to 100% fib level.
I'm holding $60 leaps (01/23).

Jinko to The MOONJinko has finally broken out on the chart, as you can see. I think this is a great solar/green energy stock pick. I expect the whole solar energy market to do really well in the coming months, with rising general electricity costs

$JKS Swing$JKS holding short term trend line up , getting tight in the triangle. Expecting a move higher but needs to clear $48.5 in the near term.
Break below trend line invalidates trade.

JinkoSolar Analysis 12.09.2021Hello Traders,
welcome to this free and educational analysis.
I am going to explain where I think this asset is going to go over the next days/weeks and where I would look for trading opportunities.
If you have any questions or suggestions which asset I should analyse tomorrow, please leave a comment below.
I would also appreciate, if you would smash that like button and help me to create more free analysis like that.
Thank you for watching and I will see you tomorrow!
