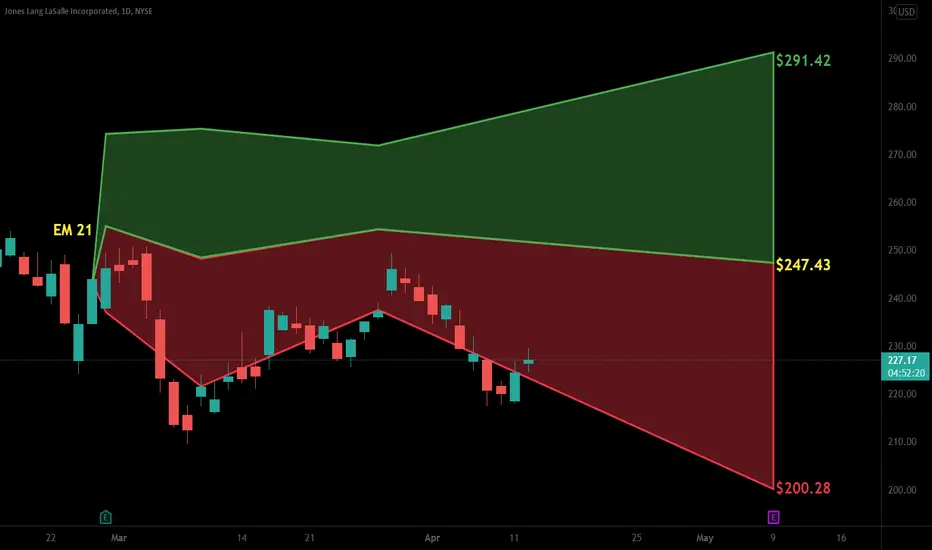
JLL Bounce Above TrendA down trend can be plotted in both scenarios and also in both scenarios a price jump above on the third test can be observed
In the first case this led to a price rise
We just need to wait to see if the price rise repeats in the second up bounce above trend line
The 200MA is kinda irrelevant but in both cases the up bounces (in green) are above the 200MA
JLL trade ideas

$JLL with a Bullish outlook following its earnings #Stocks The PEAD projected a Bullish outlook for $JLL after a Negative over reaction following its earnings release placing the stock in drift C.

BUY to JONES LANG LASALLE Daily Hey guys, JONES LANG LASALLE is in a false low configuration with a high volume of past purchases and a large trace of rejected sellers. In TIMEFRAME M1 we can see a dragonfly doji bullish with a low volume big potential to break the VWAP to join the last precedent above. And if the buyers are there with liquidity to fill the bearish breakout gap to reach the next high (See TIMEFRAME H4). Not enough buying force to close the second bearish breakout gap in Daily on ANDREWS PITCHFORCK.
Please LIKE & FOLLOW, thank you!

JLL —— Under Death 50,200MA, 40VWMA (Don’t chase the money!)JLL——50,200MA, 40VWMA.
The 200MA is under Death at this time it is in the process of forming a goldenX to try to penetrate double top, will hold under evaluation.
***** The money will follow*****

Jones Lang Lasalle JLL 201950% minimun fall from DOUBLE top to the confuelce of resistance, moveing average and mid channel.
The worst... The extension of this double top is BELOW 0
The RSI has EXACTLY the coincidence EVEN on time. Maybe around summer.
If the MASTER of this sector falls.... all down with him. The next Lehman Brothers of the Real Estate??


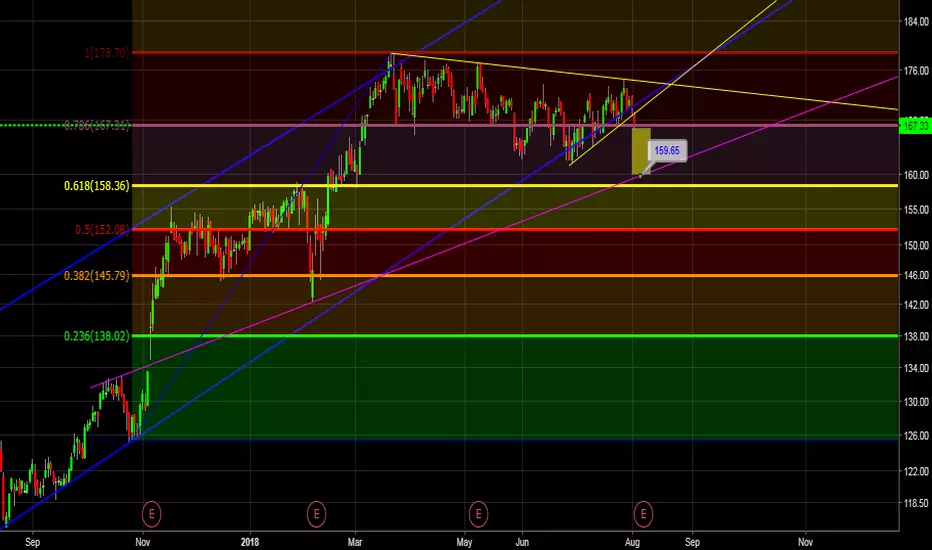
JLL : ready to try new high? (Strong Buy)JLL is trying historical high, showing bullish flag pattern around previous high.
Make sure it strongly break out previous high ( around 172 ) and ( around 177 ) with increased volume.
Stop Loss : $161
The following is weekly.


JLL- Fallen angel pattern long from $94, & $90 & $95 March CallsJLL
Date First Found - November 15, 2016
Pattern/Why- fallen angel, bullish momentum
Entry Target Criteria- break above $94.00 (hit November 15, 2016)
Exit Target Criteria- Target 1 $114.00 Target 2 $143.00
Stop Loss Criteria- $85.35
Indicator Notes- strong improvement in Twiggs Money Flow, insider buying
Special Note- we would consider March $90 Calls @ $12.10 or March $95 Calls @ $9.00


JLL gaps up but remains below pivot highJLL yesterday gapped up on higher volume and a good earnings report. But it hasn't yet comfortably cleared the recent pivot high of 2nd April.
I last looked at JLL 5 months ago in November 2014. The analysis suggested price would be heading higher - which it has done. But some of the pullbacks have been a little deeper than a trend trader would have liked - breaching the 50sma support on a couple of occasions. These pullbacks were within acceptable limits but a more linear trending chart would not have caused as much equity volatility.
Yesterday's spinning top/doji - and the fact price failed to break above the recent pivot high in a meaningful way - means that momentum is not as strong to the upside as I would like. I would expect to see a continuation of the uptrend but we need to see a bit more conviction with a stronger, more bullish bar.
A possibly buy opportunity in the near future.

JLL bullish after breaking 2007 highNow JLL has broken and retested the 2007 high ($124.99) there is room for price to move further to the upside.
There was a cluster of support at around $125 but it dipped just below this during the October pullback (which affected most stocks). It found support at the 50ma on the weekly chart but popped below the 200ma on the daily chart.
Since then price has cleared the more recent August high and yesterday a bullish flag was confirmed. In the last year this stock has trended well - a few of the pullbacks have been a little on the deep side but, other than October's, they would not have presented an issue to the longer-term trend trader.


